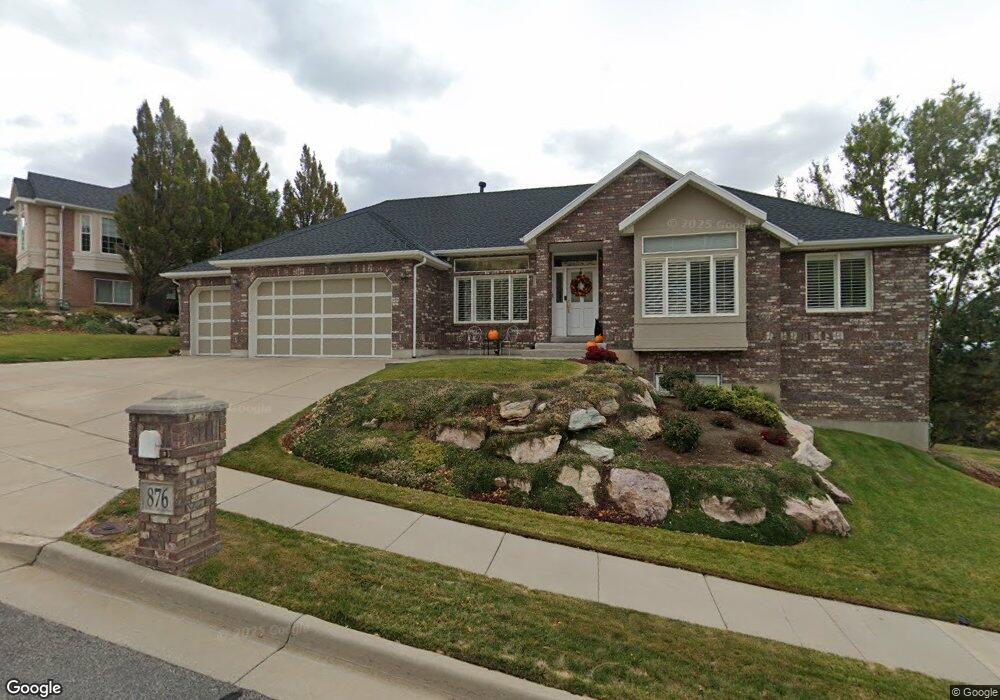
876 Ridgeline Cir Unit 8 Centerville, UT 84014
Estimated Value: $740,000 - $847,000
5
Beds
4
Baths
2,017
Sq Ft
$397/Sq Ft
Est. Value
About This Home
This home is located at 876 Ridgeline Cir Unit 8, Centerville, UT 84014 and is currently estimated at $801,698, approximately $397 per square foot. 876 Ridgeline Cir Unit 8 is a home located in Davis County with nearby schools including J A Taylor Elementary School, Centerville Jr High, and Viewmont High School.
Ownership History
Date
Name
Owned For
Owner Type
Purchase Details
Closed on
Jan 24, 2024
Sold by
Harper Randy K and Harper Kathy L
Bought by
Harper Family Trust and Harper
Current Estimated Value
Purchase Details
Closed on
Jul 2, 2002
Sold by
Conrad Frank L and Conrad Georgann R
Bought by
Harper Randy K and Keszler Kathy L
Home Financials for this Owner
Home Financials are based on the most recent Mortgage that was taken out on this home.
Original Mortgage
$255,900
Interest Rate
6.15%
Purchase Details
Closed on
May 13, 1999
Sold by
Anderson Homes Lc
Bought by
Conrad Frank L and Conrad Georgann R
Home Financials for this Owner
Home Financials are based on the most recent Mortgage that was taken out on this home.
Original Mortgage
$235,100
Interest Rate
6.94%
Purchase Details
Closed on
Nov 4, 1998
Sold by
Island View Construction Inc
Bought by
Anderson Homes L C
Create a Home Valuation Report for This Property
The Home Valuation Report is an in-depth analysis detailing your home's value as well as a comparison with similar homes in the area
Purchase History
We collect this data history from publicly available records. To have your information removed, we recommend requesting removal directly through your county’s website.
| Date | Buyer | Sale Price | Title Company |
|---|---|---|---|
| Harper Family Trust | -- | None Listed On Document | |
| Harper Randy K | -- | Mountain View Title & Escrow | |
| Conrad Frank L | -- | First American Title Co | |
| Anderson Homes L C | -- | Security Title |
Source: Public Records
Mortgage History
We collect this data history from publicly available records. To have your information removed, we recommend requesting removal directly through your county’s website.
| Date | Status | Borrower | Loan Amount |
|---|---|---|---|
| Previous Owner | Harper Randy K | $255,900 | |
| Previous Owner | Conrad Frank L | $235,100 |
Source: Public Records
Tax History
| Year | Tax Paid | Tax Assessment Tax Assessment Total Assessment is a certain percentage of the fair market value that is determined by local assessors to be the total taxable value of land and additions on the property. | Land | Improvement |
|---|---|---|---|---|
| 2025 | $4,312 | $412,500 | $180,985 | $231,515 |
| 2024 | $4,048 | $393,800 | $165,008 | $228,792 |
| 2023 | $4,028 | $708,000 | $280,341 | $427,659 |
| 2022 | $4,136 | $400,400 | $142,210 | $258,190 |
| 2021 | $3,628 | $547,000 | $220,679 | $326,321 |
| 2020 | $3,376 | $509,000 | $213,725 | $295,275 |
| 2019 | $3,321 | $489,000 | $208,225 | $280,775 |
| 2018 | $3,334 | $485,000 | $192,888 | $292,112 |
| 2016 | $2,806 | $226,875 | $68,135 | $158,740 |
| 2015 | $3,035 | $231,495 | $68,135 | $163,360 |
| 2014 | $3,860 | $206,250 | $68,135 | $138,115 |
| 2013 | -- | $240,742 | $63,971 | $176,771 |
Source: Public Records
Map
Nearby Homes
- 876 Ridgeline Cir
- 892 Ridgeline Cir
- 867 S 850 E
- 889 S 850 E
- 867 Island View Dr
- 902 Ridgeline Cir
- 873 Ridgeline Cir
- 871 Ridgeline Cir
- 913 S 850 E
- 861 Sunrise Cir
- 865 Ridgeline Cir
- 897 Ridgeline Cir
- 820 Sunrise Cir
- 880 S 850 E
- 847 Sunrise Cir
- 937 Island View Dr
- 937 Island View Dr
- 840 S 850 E
- 910 Island View Dr
- 937 S 850 E
Your Personal Tour Guide
Ask me questions while you tour the home.