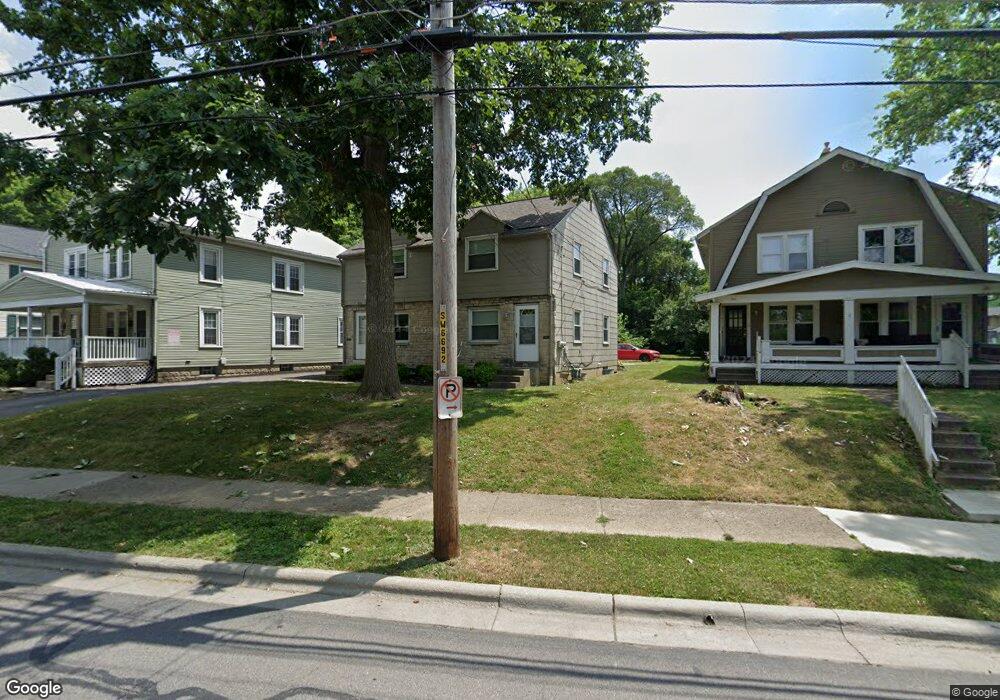
876 Sheridan Ave Columbus, OH 43209
Estimated Value: $357,000 - $398,000
4
Beds
2
Baths
1,914
Sq Ft
$196/Sq Ft
Est. Value
About This Home
This home is located at 876 Sheridan Ave, Columbus, OH 43209 and is currently estimated at $374,247, approximately $195 per square foot. 876 Sheridan Ave is a home located in Franklin County with nearby schools including Montrose Elementary School, Bexley Middle School, and Bexley High School.
Ownership History
Date
Name
Owned For
Owner Type
Purchase Details
Closed on
Feb 26, 2009
Sold by
Mrr Holdings Ltd
Bought by
Msa Equity Llc
Current Estimated Value
Home Financials for this Owner
Home Financials are based on the most recent Mortgage that was taken out on this home.
Original Mortgage
$122,000
Outstanding Balance
$86,743
Interest Rate
7.5%
Mortgage Type
Future Advance Clause Open End Mortgage
Estimated Equity
$287,504
Purchase Details
Closed on
Jun 26, 2008
Sold by
Mrr Properties I Ltd
Bought by
Mrr Holdings Ltd
Purchase Details
Closed on
Sep 8, 2006
Sold by
Milenkovich John L
Bought by
Racette Matthew R
Home Financials for this Owner
Home Financials are based on the most recent Mortgage that was taken out on this home.
Original Mortgage
$146,200
Interest Rate
6.7%
Mortgage Type
Purchase Money Mortgage
Purchase Details
Closed on
Jul 16, 2004
Sold by
Estate Of Sophie Milenkovich
Bought by
Milenkovich James
Purchase Details
Closed on
Jun 20, 1969
Bought by
Milenkovich James
Create a Home Valuation Report for This Property
The Home Valuation Report is an in-depth analysis detailing your home's value as well as a comparison with similar homes in the area
Home Values in the Area
Average Home Value in this Area
Purchase History
| Date | Buyer | Sale Price | Title Company |
|---|---|---|---|
| Msa Equity Llc | $135,000 | Talon Group | |
| Mrr Holdings Ltd | -- | Attorney | |
| Racette Matthew R | $108,500 | Bexley Titl | |
| Milenkovich James | -- | -- | |
| Milenkovich James | -- | -- |
Source: Public Records
Mortgage History
| Date | Status | Borrower | Loan Amount |
|---|---|---|---|
| Open | Msa Equity Llc | $122,000 | |
| Previous Owner | Racette Matthew R | $146,200 |
Source: Public Records
Tax History Compared to Growth
Tax History
| Year | Tax Paid | Tax Assessment Tax Assessment Total Assessment is a certain percentage of the fair market value that is determined by local assessors to be the total taxable value of land and additions on the property. | Land | Improvement |
|---|---|---|---|---|
| 2024 | $5,795 | $102,380 | $31,150 | $71,230 |
| 2023 | $5,221 | $102,375 | $31,150 | $71,225 |
| 2022 | $4,327 | $68,150 | $13,650 | $54,500 |
| 2021 | $4,330 | $68,150 | $13,650 | $54,500 |
| 2020 | $4,293 | $68,150 | $13,650 | $54,500 |
| 2019 | $4,067 | $56,810 | $11,380 | $45,430 |
| 2018 | $3,670 | $56,810 | $11,380 | $45,430 |
| 2017 | $3,623 | $56,810 | $11,380 | $45,430 |
| 2016 | $3,780 | $56,600 | $13,900 | $42,700 |
| 2015 | $3,794 | $56,600 | $13,900 | $42,700 |
| 2014 | $3,815 | $56,600 | $13,900 | $42,700 |
| 2013 | $1,889 | $53,900 | $13,230 | $40,670 |
Source: Public Records
Map
Nearby Homes
- 866-868 Sheridan Ave
- 945 Francis Ave
- 849 Lyman Ave
- 563 S Dawson Ave
- 905 Vernon Rd
- 891 Vernon Rd
- 782 S Remington Rd
- 2424 Sherwood Rd
- 592 Rhoads Ave Unit 594
- 2425 Bryden Rd
- 1751 Bide A Wee Park Ave
- 1052 S Roosevelt Ave
- 895 Grandon Ave
- 419 Westland Ave
- 1800 E Fulton St
- 696 Vernon Rd
- 751 Bulen Ave
- 572 Bulen Ave
- 639 Bulen Ave
- 2564 Sherwood Rd
- 876 Sheridan Ave Unit 878
- 876-878 Sheridan Ave
- 870 Sheridan Ave Unit 72
- 882 Sheridan Ave Unit 84
- 872 Sheridan Ave
- 866 Sheridan Ave Unit 68
- 862 Sheridan Ave
- 875 College Ave
- 885 College Ave
- 856 Sheridan Ave
- 869 College Ave
- 875 Sheridan Ave
- 887 College Ave
- 865 College Ave
- 873 Sheridan Ave Unit 875
- 889 Sheridan Ave
- 850 Sheridan Ave
- 871 Sheridan Ave
- 859 College Ave
- 899 Sheridan Ave