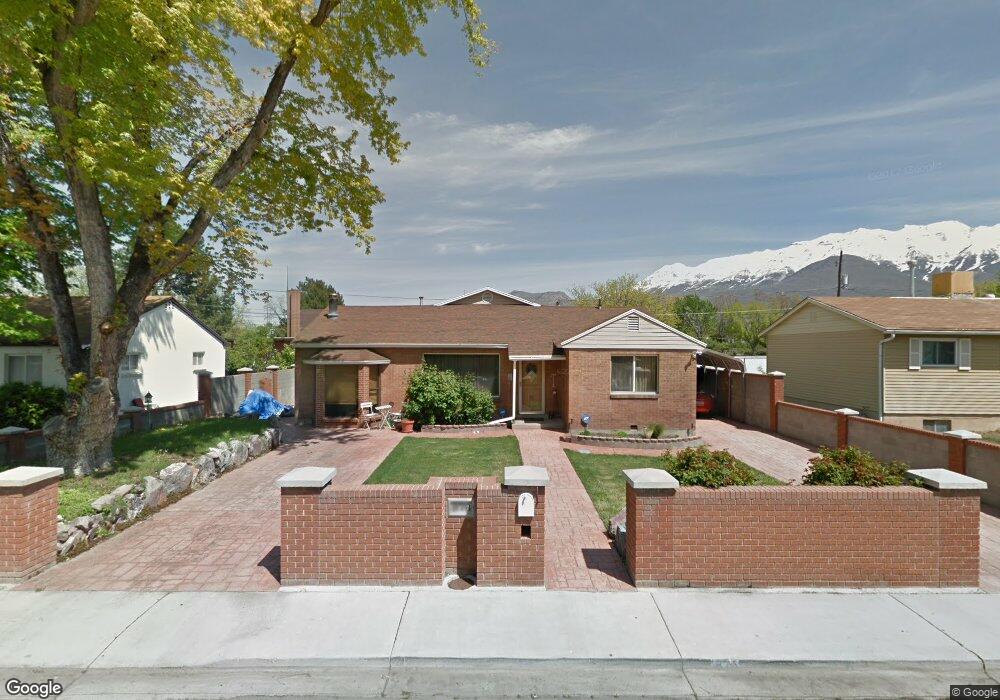
876 W 530 N Orem, UT 84057
Geneva NeighborhoodEstimated Value: $508,143 - $647,000
4
Beds
2
Baths
2,123
Sq Ft
$264/Sq Ft
Est. Value
About This Home
This home is located at 876 W 530 N, Orem, UT 84057 and is currently estimated at $560,536, approximately $264 per square foot. 876 W 530 N is a home located in Utah County with nearby schools including Orem Junior High School, Timpanogos High School, and Karl Maeser Preparatory Academy.
Ownership History
Date
Name
Owned For
Owner Type
Purchase Details
Closed on
Oct 16, 2018
Sold by
Thomas John Patrick
Bought by
Thomas John Patrick and Thomas Jana M
Current Estimated Value
Home Financials for this Owner
Home Financials are based on the most recent Mortgage that was taken out on this home.
Original Mortgage
$195,000
Outstanding Balance
$121,114
Interest Rate
4.5%
Mortgage Type
New Conventional
Estimated Equity
$439,422
Purchase Details
Closed on
Oct 19, 2010
Sold by
Arch Bay Holdings Llc Series 2010B
Bought by
Thomas John Patrick
Home Financials for this Owner
Home Financials are based on the most recent Mortgage that was taken out on this home.
Original Mortgage
$152,000
Interest Rate
5.5%
Mortgage Type
Adjustable Rate Mortgage/ARM
Purchase Details
Closed on
Sep 2, 2010
Sold by
Reo Properties Corporation
Bought by
Arch Bay Holdings Llc Series 2010B
Home Financials for this Owner
Home Financials are based on the most recent Mortgage that was taken out on this home.
Original Mortgage
$152,000
Interest Rate
5.5%
Mortgage Type
Adjustable Rate Mortgage/ARM
Purchase Details
Closed on
Jun 14, 2010
Sold by
Leach Frank L and Leach Lee Ann
Bought by
Reo Properties Corporation
Purchase Details
Closed on
Jul 5, 2007
Sold by
Leach Lee Ann
Bought by
Leach Frank L and Leach Lee Ann
Purchase Details
Closed on
Feb 19, 2004
Sold by
Weinstock David S and Weinstock Kathleen
Bought by
Leach Lee Ann
Home Financials for this Owner
Home Financials are based on the most recent Mortgage that was taken out on this home.
Original Mortgage
$139,500
Interest Rate
7.85%
Mortgage Type
Purchase Money Mortgage
Purchase Details
Closed on
Apr 12, 2000
Sold by
Weinstock David S and Weinstock Kathleen
Bought by
Weinstock David S and Weinstock Kathleen
Home Financials for this Owner
Home Financials are based on the most recent Mortgage that was taken out on this home.
Original Mortgage
$162,000
Interest Rate
8.26%
Purchase Details
Closed on
Mar 14, 2000
Sold by
Leach Lee Ann
Bought by
Weinstock David S and Weinstock Katheleen
Home Financials for this Owner
Home Financials are based on the most recent Mortgage that was taken out on this home.
Original Mortgage
$162,000
Interest Rate
8.26%
Create a Home Valuation Report for This Property
The Home Valuation Report is an in-depth analysis detailing your home's value as well as a comparison with similar homes in the area
Home Values in the Area
Average Home Value in this Area
Purchase History
| Date | Buyer | Sale Price | Title Company |
|---|---|---|---|
| Thomas John Patrick | -- | Vanguard Title Ins Agency Ll | |
| Thomas John Patrick | -- | Highland Title | |
| Arch Bay Holdings Llc Series 2010B | -- | Highland Title | |
| Reo Properties Corporation | $129,200 | Etitle Insurance Agency | |
| Leach Frank L | -- | Title West Title Company | |
| Leach Lee Ann | -- | Empire Land Title Company | |
| Weinstock David S | -- | Inwest Title Services Inc | |
| Weinstock David S | -- | Inwest Title Services Inc |
Source: Public Records
Mortgage History
| Date | Status | Borrower | Loan Amount |
|---|---|---|---|
| Open | Thomas John Patrick | $195,000 | |
| Closed | Thomas John Patrick | $152,000 | |
| Previous Owner | Leach Lee Ann | $139,500 | |
| Previous Owner | Weinstock David S | $162,000 | |
| Previous Owner | Weinstock David S | $162,000 |
Source: Public Records
Tax History
| Year | Tax Paid | Tax Assessment Tax Assessment Total Assessment is a certain percentage of the fair market value that is determined by local assessors to be the total taxable value of land and additions on the property. | Land | Improvement |
|---|---|---|---|---|
| 2025 | $1,863 | $240,625 | -- | -- |
| 2024 | $1,863 | $227,755 | $0 | $0 |
| 2023 | $1,740 | $228,690 | $0 | $0 |
| 2022 | $1,702 | $216,755 | $0 | $0 |
| 2021 | $1,419 | $301,500 | $110,400 | $191,100 |
| 2020 | $1,445 | $273,800 | $88,300 | $185,500 |
| 2019 | $1,266 | $249,600 | $88,300 | $161,300 |
| 2018 | $1,202 | $226,300 | $84,900 | $141,400 |
| 2017 | $1,082 | $109,175 | $0 | $0 |
| 2016 | $1,089 | $101,310 | $0 | $0 |
| 2015 | $1,063 | $93,555 | $0 | $0 |
| 2014 | $941 | $82,445 | $0 | $0 |
Source: Public Records
Map
Nearby Homes
- 875 W 530 N
- 489 N Beverly Ave
- 557 N Emery Ave
- 954 W 630 N Unit 34,
- 474 N Emery Ave
- 776 W 640 N
- 686 N 835 W
- 1058 W 570 St N
- 1094 W 465 N
- 574 N 600 W
- 222 N 1200 W Unit 144
- 222 N 1200 W Unit 53
- 222 N 1200 W Unit 84
- 663 N 550 W
- 454 N 1235 W
- 930 N 980 W
- 645 W 920 N
- 45 N 970 W
- 1015 N 995 W
- 1140 W 950 N Unit D302
Your Personal Tour Guide
Ask me questions while you tour the home.