Estimated Value: $615,000 - $719,087
3
Beds
2
Baths
3,338
Sq Ft
$204/Sq Ft
Est. Value
About This Home
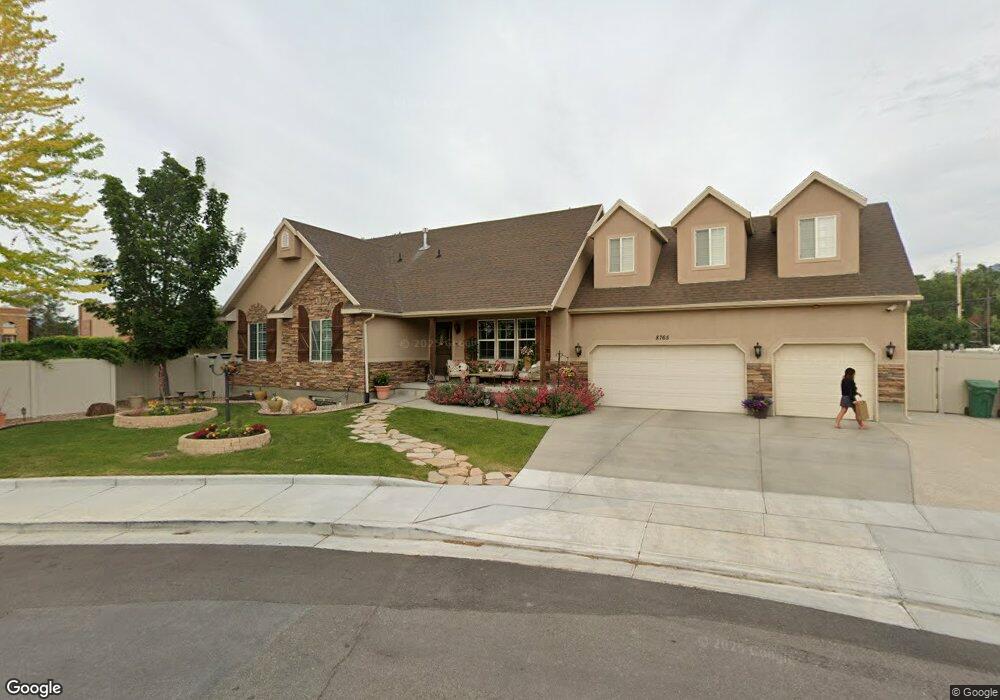
This home is located at 8765 S 420 E, Sandy, UT 84070 and is currently estimated at $682,272, approximately $204 per square foot. 8765 S 420 E is a home located in Salt Lake County with nearby schools including Sandy Elementary School, Mount Jordan Middle School, and Jordan High.
Ownership History
Date
Name
Owned For
Owner Type
Purchase Details
Closed on
Aug 22, 2023
Sold by
Worthen Trent
Bought by
Worthen J Trent J and Worthen Mindy A
Current Estimated Value
Home Financials for this Owner
Home Financials are based on the most recent Mortgage that was taken out on this home.
Original Mortgage
$100,000
Outstanding Balance
$94,740
Interest Rate
6.81%
Mortgage Type
Credit Line Revolving
Estimated Equity
$587,532
Purchase Details
Closed on
May 25, 2012
Sold by
Worthen J Trent
Bought by
Worthen J Trent
Home Financials for this Owner
Home Financials are based on the most recent Mortgage that was taken out on this home.
Original Mortgage
$304,000
Interest Rate
5.5%
Mortgage Type
Adjustable Rate Mortgage/ARM
Purchase Details
Closed on
Jan 4, 2005
Sold by
Shaw Homes Inc
Bought by
Worthen J Trent
Home Financials for this Owner
Home Financials are based on the most recent Mortgage that was taken out on this home.
Original Mortgage
$235,701
Interest Rate
5.7%
Mortgage Type
FHA
Create a Home Valuation Report for This Property
The Home Valuation Report is an in-depth analysis detailing your home's value as well as a comparison with similar homes in the area
Home Values in the Area
Average Home Value in this Area
Purchase History
| Date | Buyer | Sale Price | Title Company |
|---|---|---|---|
| Worthen J Trent J | -- | Titan Title Insurance Agency I | |
| Worthen J Trent | -- | Titan Title Ins Agcy Inc | |
| Worthen J Trent | -- | Superior Title |
Source: Public Records
Mortgage History
| Date | Status | Borrower | Loan Amount |
|---|---|---|---|
| Open | Worthen J Trent J | $100,000 | |
| Previous Owner | Worthen J Trent | $304,000 | |
| Previous Owner | Worthen J Trent | $235,701 |
Source: Public Records
Tax History
| Year | Tax Paid | Tax Assessment Tax Assessment Total Assessment is a certain percentage of the fair market value that is determined by local assessors to be the total taxable value of land and additions on the property. | Land | Improvement |
|---|---|---|---|---|
| 2025 | $3,477 | $707,900 | $131,500 | $576,400 |
| 2024 | $3,477 | $643,100 | $120,700 | $522,400 |
| 2023 | $3,125 | $576,300 | $114,700 | $461,600 |
| 2022 | $3,371 | $607,300 | $112,500 | $494,800 |
| 2021 | $3,235 | $496,100 | $88,000 | $408,100 |
| 2020 | $3,042 | $439,900 | $88,000 | $351,900 |
| 2019 | $2,788 | $392,900 | $88,000 | $304,900 |
| 2017 | $2,352 | $329,700 | $63,400 | $266,300 |
| 2016 | $2,391 | $323,900 | $63,400 | $260,500 |
Source: Public Records
Map
Nearby Homes
- 412 E 8760 S
- 270 E 8680 S
- 8732 S 620 E
- 8558 S Center St
- 8459 S 300 E
- 220 E Pioneer Ave
- 194 Pioneer Ave
- 8729 S Leafwood Ln
- 8797 Green Way Unit 3
- 112 E 8680 S
- 8722 S Oakwood Park Cir
- 359 E 8400 S
- 8732 S Oakwood Park Cr
- 149 E Pioneer Ave
- 362 E 9150 S
- 87 Pioneer Ave
- 8322 S Levine Ln Unit 111
- 744 E 8425 S
- 8470 Solar Way
- 181 E 9180 S
Your Personal Tour Guide
Ask me questions while you tour the home.