Estimated Value: $613,524 - $703,000
4
Beds
4
Baths
2,358
Sq Ft
$281/Sq Ft
Est. Value
About This Home
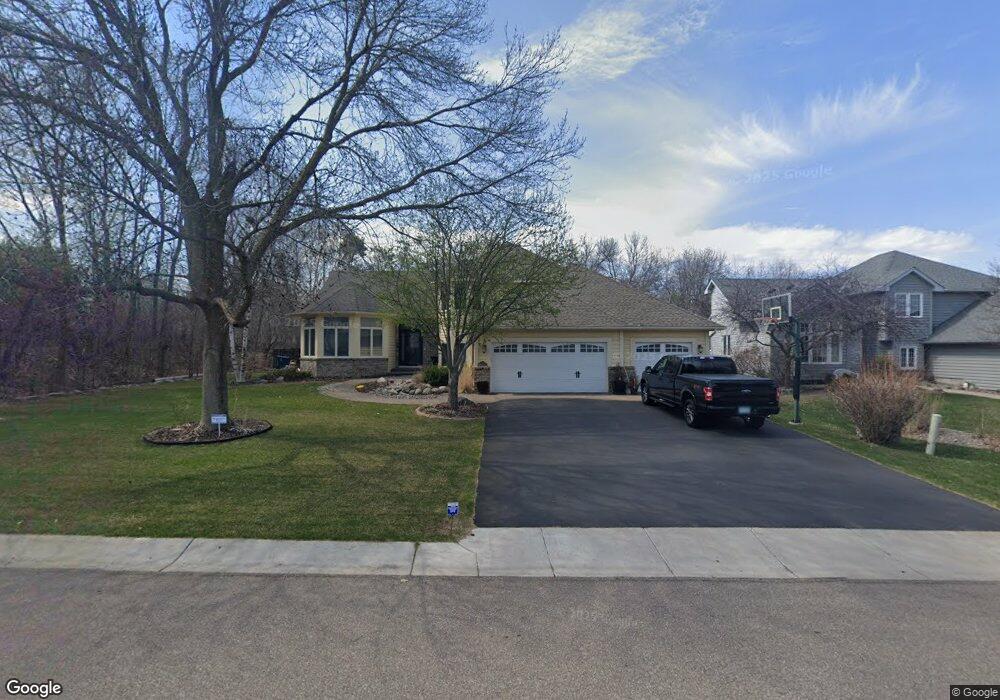
This home is located at 8767 Comstock Ln N, Osseo, MN 55311 and is currently estimated at $662,631, approximately $281 per square foot. 8767 Comstock Ln N is a home located in Hennepin County with nearby schools including Fernbrook Elementary School, Osseo Middle School, and Maple Grove Senior High School.
Ownership History
Date
Name
Owned For
Owner Type
Purchase Details
Closed on
Jul 17, 2015
Sold by
Rebtoy Charles D
Bought by
Zick Greg C and Zick Sandra C
Current Estimated Value
Home Financials for this Owner
Home Financials are based on the most recent Mortgage that was taken out on this home.
Original Mortgage
$380,000
Outstanding Balance
$295,990
Interest Rate
3.83%
Mortgage Type
New Conventional
Estimated Equity
$366,641
Purchase Details
Closed on
Oct 31, 2007
Sold by
Prather Willian C
Bought by
Rebtoy Charles D
Purchase Details
Closed on
Apr 21, 2006
Sold by
Bjustrom Jeffrey J and Bjustrom Kimberly A
Bought by
Prather William C
Create a Home Valuation Report for This Property
The Home Valuation Report is an in-depth analysis detailing your home's value as well as a comparison with similar homes in the area
Home Values in the Area
Average Home Value in this Area
Purchase History
| Date | Buyer | Sale Price | Title Company |
|---|---|---|---|
| Zick Greg C | $475,000 | Liberty Title Inc | |
| Rebtoy Charles D | $437,200 | -- | |
| Prather William C | $470,000 | -- |
Source: Public Records
Mortgage History
| Date | Status | Borrower | Loan Amount |
|---|---|---|---|
| Open | Zick Greg C | $380,000 |
Source: Public Records
Tax History Compared to Growth
Tax History
| Year | Tax Paid | Tax Assessment Tax Assessment Total Assessment is a certain percentage of the fair market value that is determined by local assessors to be the total taxable value of land and additions on the property. | Land | Improvement |
|---|---|---|---|---|
| 2024 | $7,644 | $580,200 | $122,600 | $457,600 |
| 2023 | $7,928 | $619,100 | $160,600 | $458,500 |
| 2022 | $6,225 | $573,800 | $103,700 | $470,100 |
| 2021 | $5,985 | $480,600 | $78,700 | $401,900 |
| 2020 | $6,290 | $453,100 | $67,000 | $386,100 |
| 2019 | $5,763 | $453,700 | $79,000 | $374,700 |
| 2018 | $5,818 | $418,500 | $57,000 | $361,500 |
| 2017 | $5,879 | $402,200 | $63,000 | $339,200 |
| 2016 | $5,754 | $389,100 | $75,000 | $314,100 |
| 2015 | $5,646 | $369,700 | $75,000 | $294,700 |
| 2014 | -- | $343,500 | $80,000 | $263,500 |
Source: Public Records
Map
Nearby Homes
- 8858 Comstock Ct
- 16955 Weaver Lake Dr
- 9062 Archer Ln N
- 9138 Comstock Ln N Unit 204
- 9150 Comstock Ln N
- 10145 Peony Ln N
- 10154 Peony Ln N
- 9190 Archer Ln N
- 7200 Comstock Ln N
- 9245 Holly Ln N Unit 704
- 17475 90th Ave N
- 8566 Quarles Rd
- 9125 Olive Ln N
- 9440 Jewel Ln N
- 9260 Merrimac Ln N
- 9246 Shenandoah Ln N
- 9433 Jewel Ln N
- 18053 90th Place N
- 18244 88th Place N
- 9340 Ranchview Ln N
- 8779 Comstock Ln N
- 8791 Comstock Ln N
- 8813 Comstock Ct
- 8768 Comstock Ln N
- 8723 Comstock Ln N
- 8744 Comstock Ln N
- 8780 Comstock Ln N
- 8722 Comstock Ln N
- 8792 Comstock Ln N
- 8701 Comstock Ln N
- 8803 Comstock Ln N
- 8837 Comstock Ct
- 8798 Comstock Ln N
- 8700 Comstock Ln N
- 8824 Comstock Ct
- 8725 Blackoaks Ln N
- 8737 Blackoaks Ln N
- 8770 Everest Ln N
- 8815 Comstock Ln N
- 8859 Comstock Ct