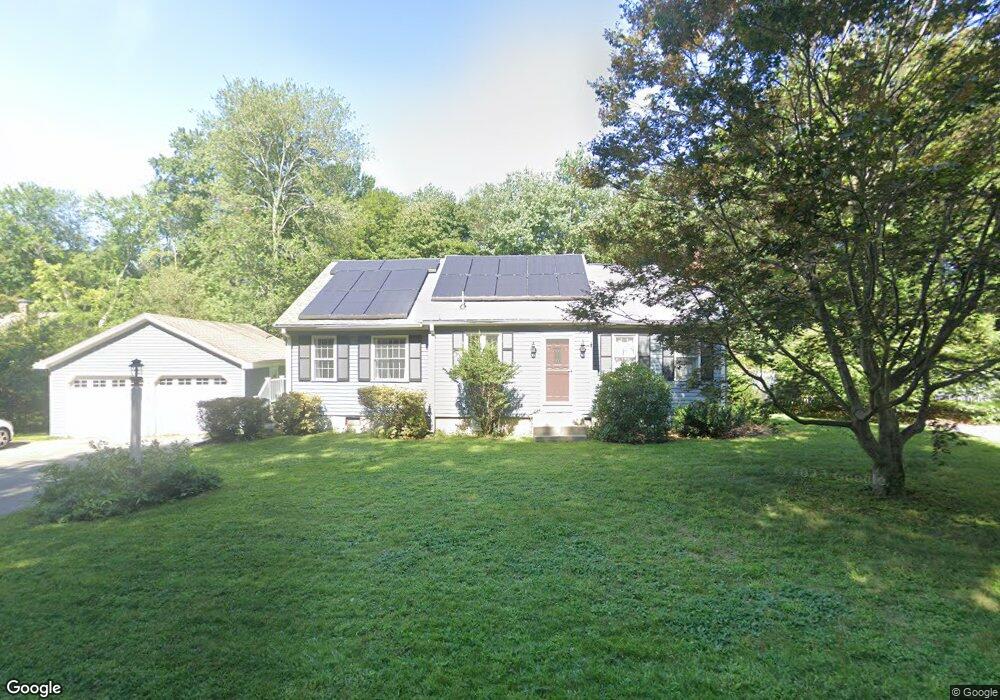
877 South St Walpole, MA 02081
Estimated Value: $726,397 - $818,000
4
Beds
2
Baths
2,067
Sq Ft
$366/Sq Ft
Est. Value
About This Home
This home is located at 877 South St, Walpole, MA 02081 and is currently estimated at $756,349, approximately $365 per square foot. 877 South St is a home located in Norfolk County with nearby schools including Boyden School, Eleanor N. Johnson Middle School, and Walpole High School.
Ownership History
Date
Name
Owned For
Owner Type
Purchase Details
Closed on
Oct 25, 2016
Sold by
Bond Brian K and Anderson Sung K
Bought by
Bond Anderson Rt
Current Estimated Value
Purchase Details
Closed on
Apr 28, 2006
Sold by
Brunelli Robert E and Brunelli Carol A
Bought by
Bond Brian K and Anderson Sung K
Home Financials for this Owner
Home Financials are based on the most recent Mortgage that was taken out on this home.
Original Mortgage
$264,900
Interest Rate
6.4%
Mortgage Type
Purchase Money Mortgage
Create a Home Valuation Report for This Property
The Home Valuation Report is an in-depth analysis detailing your home's value as well as a comparison with similar homes in the area
Home Values in the Area
Average Home Value in this Area
Purchase History
| Date | Buyer | Sale Price | Title Company |
|---|---|---|---|
| Bond Anderson Rt | -- | -- | |
| Bond Brian K | $439,900 | -- |
Source: Public Records
Mortgage History
| Date | Status | Borrower | Loan Amount |
|---|---|---|---|
| Previous Owner | Bond Brian K | $264,900 |
Source: Public Records
Tax History Compared to Growth
Tax History
| Year | Tax Paid | Tax Assessment Tax Assessment Total Assessment is a certain percentage of the fair market value that is determined by local assessors to be the total taxable value of land and additions on the property. | Land | Improvement |
|---|---|---|---|---|
| 2025 | $8,170 | $636,800 | $320,200 | $316,600 |
| 2024 | $7,923 | $599,300 | $307,800 | $291,500 |
| 2023 | $7,624 | $548,900 | $267,700 | $281,200 |
| 2022 | $7,197 | $497,700 | $247,900 | $249,800 |
| 2021 | $6,766 | $455,900 | $233,900 | $222,000 |
| 2020 | $6,621 | $441,700 | $220,700 | $221,000 |
| 2019 | $6,436 | $426,200 | $212,200 | $214,000 |
| 2018 | $6,122 | $400,900 | $204,500 | $196,400 |
| 2017 | $5,907 | $385,300 | $196,600 | $188,700 |
| 2016 | $5,757 | $370,000 | $189,000 | $181,000 |
| 2015 | $5,564 | $354,400 | $179,900 | $174,500 |
| 2014 | $5,354 | $339,700 | $179,900 | $159,800 |
Source: Public Records
Map
Nearby Homes
- 1549 Washington St Unit A
- 137 Beach St
- 16R Eldor Dr
- 69 Morningside Dr
- 1648 Main St
- 587 Common St
- 0 U S Route 1
- 2 Thompson Rd
- 1156 Washington St
- 1391 Main St Unit 304
- 1391 Main St Unit 208
- 1391 Main St Unit 305
- 1391 Main St Unit 308
- 375 Winter St
- 635 Old Post Rd Unit 303
- 635 Old Post Rd Unit 302
- 66 Oak St
- 145 South St Unit 5
- 145 South St Unit 19
- 180 Old Post Rd Unit 202
- 875 South St
- 879 South St
- 874 South St
- 883 South St
- 39 Pine St
- 29 Pine St
- 1674 Washington St
- 21 Pine St
- 860 South St
- 1658 Washington St
- 1670 Washington St
- 887 South St
- 1652 Washington St
- 1680 Washington St
- 1639 Washington St Unit 1639
- 1639 Washington St
- 45 Pine St
- 1686 Washington St
- 895 South St
- 57 Pine St