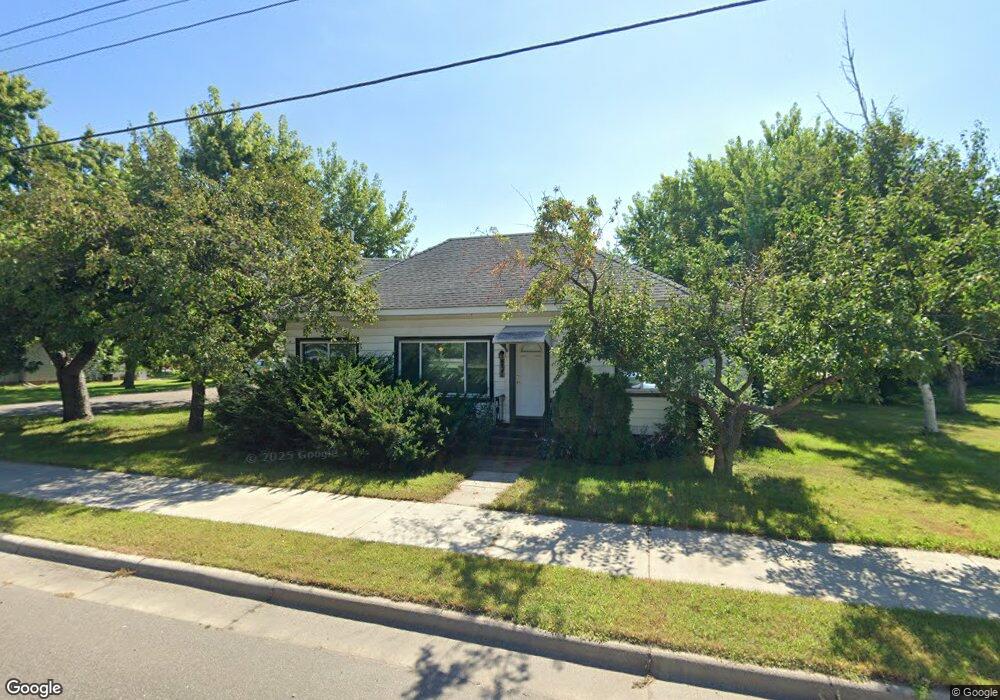
8771 Main Ave Clear Lake, MN 55319
Estimated Value: $226,000 - $302,000
2
Beds
2
Baths
1,056
Sq Ft
$244/Sq Ft
Est. Value
About This Home
This home is located at 8771 Main Ave, Clear Lake, MN 55319 and is currently estimated at $257,842, approximately $244 per square foot. 8771 Main Ave is a home located in Sherburne County with nearby schools including Clearview Elementary School and South Junior High School.
Ownership History
Date
Name
Owned For
Owner Type
Purchase Details
Closed on
Oct 31, 2016
Sold by
Salo Debra J X and Salo Randy
Bought by
Pace Douglas S
Current Estimated Value
Home Financials for this Owner
Home Financials are based on the most recent Mortgage that was taken out on this home.
Original Mortgage
$125,204
Outstanding Balance
$100,770
Interest Rate
3.5%
Mortgage Type
FHA
Estimated Equity
$157,072
Purchase Details
Closed on
Mar 3, 2016
Sold by
Evans David F and Evans David Fay
Bought by
Evans Gail A and Evans Gail Ann
Purchase Details
Closed on
Jan 22, 2016
Sold by
Ritlen Candace
Bought by
Cook Denise R and Salo Debra J
Create a Home Valuation Report for This Property
The Home Valuation Report is an in-depth analysis detailing your home's value as well as a comparison with similar homes in the area
Home Values in the Area
Average Home Value in this Area
Purchase History
| Date | Buyer | Sale Price | Title Company |
|---|---|---|---|
| Pace Douglas S | $127,552 | Preferred Title | |
| Salo Debra J | -- | None Available | |
| Evans Gail A | -- | Attorney | |
| Cook Denise R | -- | None Available |
Source: Public Records
Mortgage History
| Date | Status | Borrower | Loan Amount |
|---|---|---|---|
| Open | Salo Debra J | $125,204 | |
| Closed | Pace Douglas S | $125,204 |
Source: Public Records
Tax History Compared to Growth
Tax History
| Year | Tax Paid | Tax Assessment Tax Assessment Total Assessment is a certain percentage of the fair market value that is determined by local assessors to be the total taxable value of land and additions on the property. | Land | Improvement |
|---|---|---|---|---|
| 2025 | $2,062 | $219,400 | $86,200 | $133,200 |
| 2024 | $2,150 | $207,400 | $75,900 | $131,500 |
| 2023 | $2,062 | $206,900 | $75,900 | $131,000 |
| 2022 | $1,916 | $186,500 | $61,700 | $124,800 |
| 2020 | $1,534 | $123,800 | $29,800 | $94,000 |
| 2019 | $1,448 | $121,500 | $29,800 | $91,700 |
| 2018 | $1,394 | $112,200 | $28,900 | $83,300 |
| 2017 | $1,344 | $105,800 | $28,900 | $76,900 |
| 2016 | $1,178 | $101,200 | $28,000 | $73,200 |
| 2015 | $1,122 | $66,400 | $18,000 | $48,400 |
| 2014 | $1,122 | $61,300 | $16,800 | $44,500 |
| 2013 | -- | $61,100 | $16,800 | $44,300 |
Source: Public Records
Map
Nearby Homes