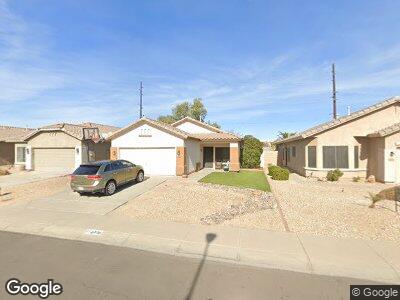
8776 W Shaw Butte Dr Peoria, AZ 85345
Estimated Value: $329,402 - $397,000
--
Bed
2
Baths
1,264
Sq Ft
$296/Sq Ft
Est. Value
About This Home
This home is located at 8776 W Shaw Butte Dr, Peoria, AZ 85345 and is currently estimated at $374,601, approximately $296 per square foot. 8776 W Shaw Butte Dr is a home located in Maricopa County with nearby schools including Cheyenne Elementary School and Peoria High School.
Ownership History
Date
Name
Owned For
Owner Type
Purchase Details
Closed on
Feb 8, 2006
Sold by
Jones Douglas B
Bought by
Jones Douglas B and Jones Anita D
Current Estimated Value
Purchase Details
Closed on
Jul 20, 2005
Sold by
Hastings Douglas E
Bought by
Jones Douglas B and Jones Anita D
Home Financials for this Owner
Home Financials are based on the most recent Mortgage that was taken out on this home.
Original Mortgage
$50,000
Interest Rate
5.56%
Mortgage Type
New Conventional
Purchase Details
Closed on
Jul 20, 1998
Sold by
Del Webbs Coventry Homes Inc
Bought by
Hastings Douglas E and Hastings Debra A
Home Financials for this Owner
Home Financials are based on the most recent Mortgage that was taken out on this home.
Original Mortgage
$98,160
Interest Rate
6.69%
Mortgage Type
FHA
Create a Home Valuation Report for This Property
The Home Valuation Report is an in-depth analysis detailing your home's value as well as a comparison with similar homes in the area
Home Values in the Area
Average Home Value in this Area
Purchase History
| Date | Buyer | Sale Price | Title Company |
|---|---|---|---|
| Jones Douglas B | -- | None Available | |
| Jones Douglas B | $225,900 | Security Title Agency Inc | |
| Hastings Douglas E | $98,894 | First American Title | |
| Del Webbs Coventry Homes Inc | -- | First American Title |
Source: Public Records
Mortgage History
| Date | Status | Borrower | Loan Amount |
|---|---|---|---|
| Open | Jones Douglas B | $45,391 | |
| Closed | Jones Douglas B | $50,000 | |
| Previous Owner | Hastings Douglas E | $114,000 | |
| Previous Owner | Hastings Douglas E | $98,160 |
Source: Public Records
Tax History Compared to Growth
Tax History
| Year | Tax Paid | Tax Assessment Tax Assessment Total Assessment is a certain percentage of the fair market value that is determined by local assessors to be the total taxable value of land and additions on the property. | Land | Improvement |
|---|---|---|---|---|
| 2025 | $1,110 | $12,007 | -- | -- |
| 2024 | $1,119 | $11,435 | -- | -- |
| 2023 | $1,119 | $24,410 | $4,880 | $19,530 |
| 2022 | $1,097 | $18,610 | $3,720 | $14,890 |
| 2021 | $1,147 | $16,860 | $3,370 | $13,490 |
| 2020 | $1,155 | $15,670 | $3,130 | $12,540 |
| 2019 | $1,121 | $14,250 | $2,850 | $11,400 |
| 2018 | $1,080 | $12,810 | $2,560 | $10,250 |
| 2017 | $1,078 | $12,020 | $2,400 | $9,620 |
| 2016 | $1,065 | $11,750 | $2,350 | $9,400 |
| 2015 | $991 | $10,970 | $2,190 | $8,780 |
Source: Public Records
Map
Nearby Homes
- 8769 W Shaw Butte Dr
- 8733 W Laurel Ln
- 8861 W Paradise Dr
- 8921 W Paradise Dr
- 8614 W Shaw Butte Dr
- 8921 W Laurel Ln
- 8605 W Paradise Dr
- 8879 W Cameron Dr
- 8795 W Windsor Dr
- 8872 W Hollywood Ave
- 12512 N 85th Ave
- 8854 W Aster Dr
- 8420 W Cherry Hills Dr
- 8863 W Greer Ave
- 13083 N 87th Dr
- 9118 W Cameron Dr
- 11411 N 91st Ave Unit 28
- 11411 N 91st Ave Unit 25
- 11411 N 91st Ave Unit 75
- 11411 N 91st Ave Unit 110
- 8776 W Shaw Butte Dr
- 8782 W Shaw Butte Dr
- 8770 W Shaw Butte Dr
- 8788 W Shaw Butte Dr
- 8764 W Shaw Butte Dr
- 8794 W Shaw Butte Dr
- 8758 W Shaw Butte Dr
- 8775 W Shaw Butte Dr
- 8781 W Shaw Butte Dr
- 8752 W Shaw Butte Dr
- 8763 W Shaw Butte Dr
- 8787 W Shaw Butte Dr
- 8757 W Shaw Butte Dr
- 8793 W Shaw Butte Dr
- 8751 W Wethersfield Rd
- 8746 W Shaw Butte Dr
- 8757 W Wethersfield Rd
- 8751 W Shaw Butte Dr
- 8745 W Wethersfield Rd
- 8808 W Shaw Butte Dr