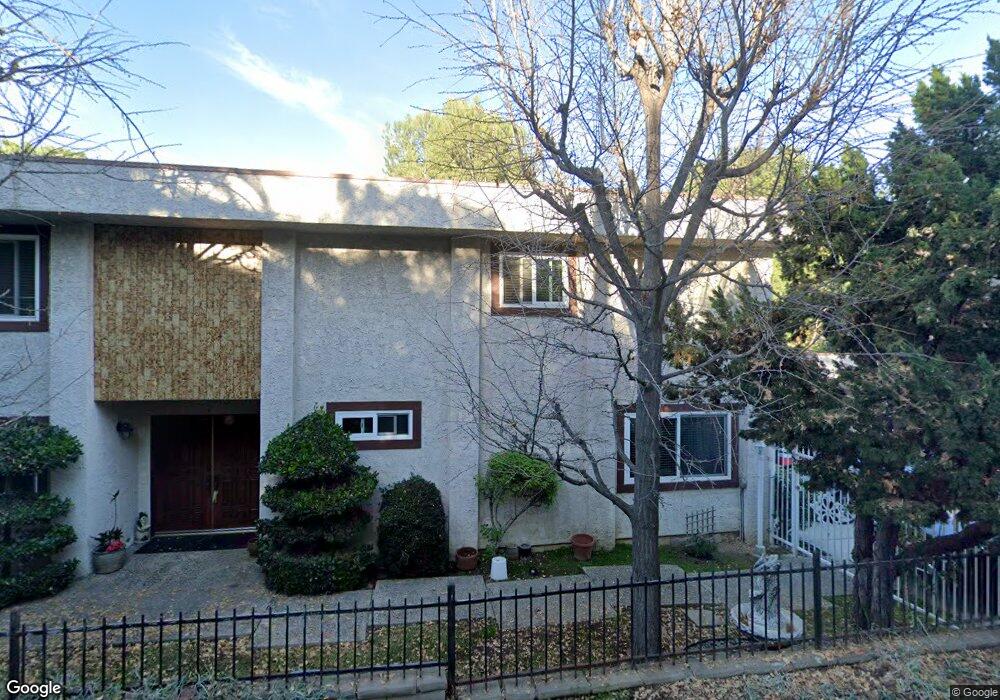
878 Flores de Oro South Pasadena, CA 91030
Estimated Value: $2,447,755 - $3,092,000
5
Beds
4
Baths
2,856
Sq Ft
$982/Sq Ft
Est. Value
About This Home
This home is located at 878 Flores de Oro, South Pasadena, CA 91030 and is currently estimated at $2,804,689, approximately $982 per square foot. 878 Flores de Oro is a home located in Los Angeles County with nearby schools including Monterey Hills Elementary, South Pasadena Middle School, and South Pasadena High School.
Ownership History
Date
Name
Owned For
Owner Type
Purchase Details
Closed on
Oct 27, 2001
Sold by
Chaudry Bharat Bhushan and Chaudry Kusum Lata
Bought by
Chaudry Bharat Bhushan and Chaudry Kusum Lata
Current Estimated Value
Purchase Details
Closed on
Jul 10, 2000
Sold by
Fu Homer and Fu Diana
Bought by
Chaudry Bharat Bhushan and Chaudry Kusum Lata
Home Financials for this Owner
Home Financials are based on the most recent Mortgage that was taken out on this home.
Original Mortgage
$450,000
Outstanding Balance
$159,770
Interest Rate
8.12%
Estimated Equity
$2,644,919
Purchase Details
Closed on
Oct 12, 1995
Sold by
Fu Homer and Fu Diana
Bought by
Fu Homer and Fu Diana
Home Financials for this Owner
Home Financials are based on the most recent Mortgage that was taken out on this home.
Original Mortgage
$400,000
Interest Rate
6.99%
Purchase Details
Closed on
Aug 18, 1993
Sold by
Fu Homer and Fu Diana
Bought by
Fu Homer and Fu Diana
Create a Home Valuation Report for This Property
The Home Valuation Report is an in-depth analysis detailing your home's value as well as a comparison with similar homes in the area
Home Values in the Area
Average Home Value in this Area
Purchase History
| Date | Buyer | Sale Price | Title Company |
|---|---|---|---|
| Chaudry Bharat Bhushan | -- | -- | |
| Chaudry Bharat Bhushan | $627,000 | First American Title Co | |
| Fu Homer | -- | South Coast Title Company | |
| Fu Homer | -- | -- |
Source: Public Records
Mortgage History
| Date | Status | Borrower | Loan Amount |
|---|---|---|---|
| Open | Chaudry Bharat Bhushan | $450,000 | |
| Previous Owner | Fu Homer | $400,000 |
Source: Public Records
Tax History Compared to Growth
Tax History
| Year | Tax Paid | Tax Assessment Tax Assessment Total Assessment is a certain percentage of the fair market value that is determined by local assessors to be the total taxable value of land and additions on the property. | Land | Improvement |
|---|---|---|---|---|
| 2025 | $11,876 | $944,771 | $687,867 | $256,904 |
| 2024 | $11,876 | $926,247 | $674,380 | $251,867 |
| 2023 | $11,625 | $908,086 | $661,157 | $246,929 |
| 2022 | $11,356 | $890,282 | $648,194 | $242,088 |
| 2021 | $11,145 | $872,827 | $635,485 | $237,342 |
| 2019 | $10,818 | $846,940 | $616,637 | $230,303 |
| 2018 | $10,470 | $830,335 | $604,547 | $225,788 |
| 2016 | $9,691 | $798,094 | $581,073 | $217,021 |
| 2015 | $9,533 | $786,107 | $572,345 | $213,762 |
| 2014 | $9,408 | $770,709 | $561,134 | $209,575 |
Source: Public Records
Map
Nearby Homes
- 838 Braewood Ct
- 868 Braewood Ct
- 701 La Portada St
- 1130 Pine St
- 1301 Spruce St
- 1218 Pine St
- 1810 Ramona Ave Unit 36
- 1515 Indiana Ave
- 1529 Indiana Ave
- 780 Monterey Rd
- 1202 Indiana Ave Unit 10
- 664 Monterey Rd
- 1416 Oak St
- 1257 Huntington Dr Unit A
- 1424 Laurel St
- 2131 Hascom
- 1715 Fair Oaks Ave Unit 15
- 1033 Indiana Ave
- 2070 Meridian Ave
- 1517 Huntington Dr
- 884 Flores de Oro
- 866 Flores de Oro
- 801 Rollin St
- 890 Flores de Oro
- 848 Flores de Oro
- 860 Flores de Oro
- 842 Flores de Oro
- 887 Flores de Oro
- 803 Rollin St
- 881 Flores de Oro
- 875 Flores de Oro
- 854 Flores de Oro
- 805 Rollin St
- 830 Flores de Oro
- 869 Flores de Oro
- 812 Flores de Oro
- 808 Braewood Ct
- 810 Rollin St
- 815 Rollin St
- 857 Flores de Oro