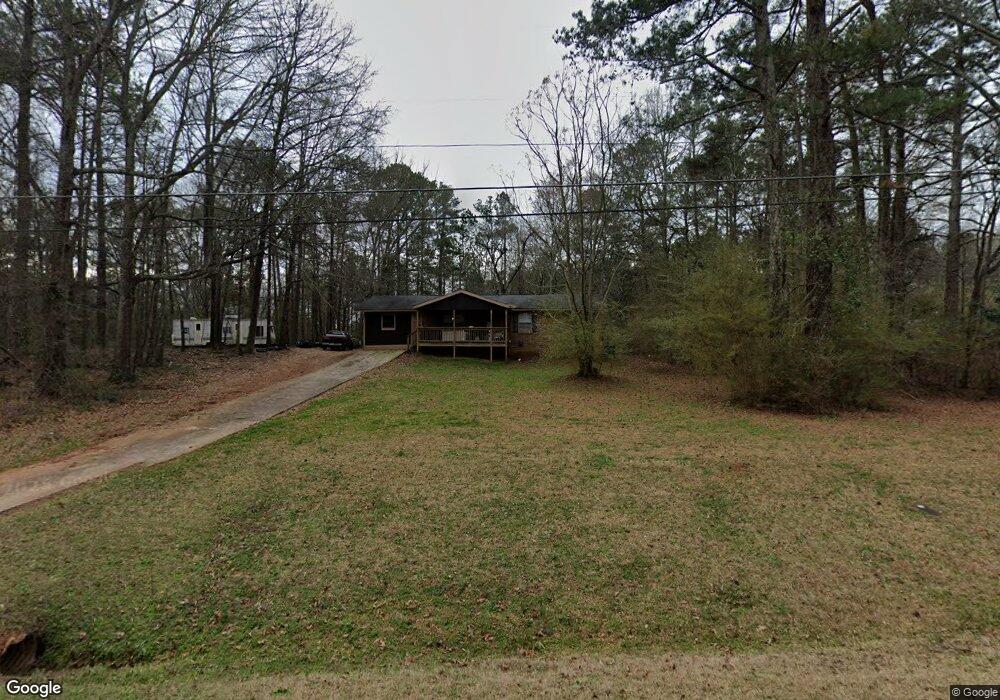
878 Futral Rd Griffin, GA 30224
Spalding County NeighborhoodEstimated Value: $108,000 - $178,000
3
Beds
2
Baths
1,075
Sq Ft
$145/Sq Ft
Est. Value
About This Home
This home is located at 878 Futral Rd, Griffin, GA 30224 and is currently estimated at $156,383, approximately $145 per square foot. 878 Futral Rd is a home located in Spalding County with nearby schools including Futral Road Elementary School, Rehoboth Road Middle School, and Spalding High School.
Ownership History
Date
Name
Owned For
Owner Type
Purchase Details
Closed on
May 29, 2018
Sold by
Hbsc Bank Usa Na
Bought by
Landham Kay
Current Estimated Value
Home Financials for this Owner
Home Financials are based on the most recent Mortgage that was taken out on this home.
Original Mortgage
$56,672
Outstanding Balance
$49,187
Interest Rate
4.66%
Estimated Equity
$107,196
Purchase Details
Closed on
Feb 27, 2018
Sold by
Hsbc Bank Usa National Ass
Bought by
Landham Kay Johnson
Purchase Details
Closed on
Dec 5, 2017
Sold by
Dennis Rosemary D
Bought by
Hsbc Bank Usa National Associa
Purchase Details
Closed on
May 20, 1977
Sold by
Farmers Home Adm
Bought by
Dennis Rosemary D
Purchase Details
Closed on
Dec 1, 1976
Sold by
Mathis James L and Mathis Cynthia
Bought by
Farmers Home Adm
Purchase Details
Closed on
Feb 5, 1972
Sold by
Clark Earnest
Bought by
Mathis James L and Mathis Cynthia
Create a Home Valuation Report for This Property
The Home Valuation Report is an in-depth analysis detailing your home's value as well as a comparison with similar homes in the area
Home Values in the Area
Average Home Value in this Area
Purchase History
| Date | Buyer | Sale Price | Title Company |
|---|---|---|---|
| Landham Kay | $41,011 | -- | |
| Landham Kay Johnson | $41,011 | -- | |
| Hsbc Bank Usa National Associa | $45,933 | -- | |
| Dennis Rosemary D | -- | -- | |
| Farmers Home Adm | -- | -- | |
| Mathis James L | $1,400 | -- |
Source: Public Records
Mortgage History
| Date | Status | Borrower | Loan Amount |
|---|---|---|---|
| Open | Landham Kay | $56,672 | |
| Closed | Landham Kay | -- |
Source: Public Records
Tax History Compared to Growth
Tax History
| Year | Tax Paid | Tax Assessment Tax Assessment Total Assessment is a certain percentage of the fair market value that is determined by local assessors to be the total taxable value of land and additions on the property. | Land | Improvement |
|---|---|---|---|---|
| 2024 | $1,412 | $39,478 | $5,320 | $34,158 |
| 2023 | $1,412 | $39,478 | $5,320 | $34,158 |
| 2022 | $1,257 | $34,564 | $4,560 | $30,004 |
| 2021 | $1,118 | $30,756 | $4,560 | $26,196 |
| 2020 | $1,122 | $30,756 | $4,560 | $26,196 |
| 2019 | $611 | $24,176 | $4,560 | $19,616 |
| 2018 | $852 | $22,302 | $4,560 | $17,742 |
| 2017 | $829 | $22,302 | $4,560 | $17,742 |
| 2016 | $85 | $22,302 | $4,560 | $17,742 |
| 2015 | $97 | $22,302 | $4,560 | $17,742 |
| 2014 | $97 | $22,302 | $4,560 | $17,742 |
Source: Public Records
Map
Nearby Homes
- 529 Knollwood
- 344 Stonewood
- 404 Woodcreek
- 324 Stonewood
- 216 Autumn Ridge Dr
- 139 Hunts Mill Cir
- 138 Hunts Mill Cir
- 105 Hunts Mill Cir
- 131 Hunts Mill Cir
- 131 Townsend Ct
- 137 Townsend Ct
- 25 Quail Hollow Rd
- 1471 Macon Rd
- 100 Glenview Dr
- 581 Hudson Rd
- 1693 S Mcdonough Rd
- 133 Four Oaks Dr
- 1226 Knowles Alley
- 1236 Knowles Alley Unit 33
- 362 Rehoboth Rd