878 Washington Ave Lowden, IA 52255
Estimated Value: $155,000 - $601,833
4
Beds
1
Bath
1,600
Sq Ft
$222/Sq Ft
Est. Value
About This Home
This home is located at 878 Washington Ave, Lowden, IA 52255 and is currently estimated at $354,611, approximately $221 per square foot. 878 Washington Ave is a home located in Cedar County with nearby schools including North Cedar Junior/Senior High School.
Ownership History
Date
Name
Owned For
Owner Type
Purchase Details
Closed on
Oct 21, 2013
Sold by
Wiesner Vickie C and Sanders David Eugene
Bought by
White Mark M and White Denise M
Current Estimated Value
Home Financials for this Owner
Home Financials are based on the most recent Mortgage that was taken out on this home.
Original Mortgage
$122,000
Outstanding Balance
$61,088
Interest Rate
4.33%
Mortgage Type
New Conventional
Estimated Equity
$293,523
Purchase Details
Closed on
Oct 4, 2007
Sold by
Wiesner Vickie C
Bought by
Wiesner Vickie C and Sanders David Eugene
Create a Home Valuation Report for This Property
The Home Valuation Report is an in-depth analysis detailing your home's value as well as a comparison with similar homes in the area
Home Values in the Area
Average Home Value in this Area
Purchase History
| Date | Buyer | Sale Price | Title Company |
|---|---|---|---|
| White Mark M | $152,500 | None Available | |
| Wiesner Vickie C | -- | None Available |
Source: Public Records
Mortgage History
| Date | Status | Borrower | Loan Amount |
|---|---|---|---|
| Open | White Mark M | $122,000 |
Source: Public Records
Tax History Compared to Growth
Tax History
| Year | Tax Paid | Tax Assessment Tax Assessment Total Assessment is a certain percentage of the fair market value that is determined by local assessors to be the total taxable value of land and additions on the property. | Land | Improvement |
|---|---|---|---|---|
| 2025 | $6,598 | $592,330 | $128,730 | $463,600 |
| 2024 | $6,598 | $575,030 | $109,600 | $465,430 |
| 2023 | $6,188 | $549,450 | $109,600 | $439,850 |
| 2022 | $5,150 | $406,510 | $63,000 | $343,510 |
| 2021 | $4,882 | $406,510 | $63,000 | $343,510 |
| 2020 | $4,704 | $361,340 | $56,000 | $305,340 |
| 2019 | $3,730 | $271,710 | $56,000 | $305,340 |
| 2018 | $2,954 | $222,760 | $0 | $0 |
| 2017 | $2,016 | $148,400 | $0 | $0 |
| 2016 | $1,930 | $142,960 | $0 | $0 |
| 2015 | $1,914 | $142,960 | $0 | $0 |
| 2014 | $1,784 | $142,960 | $0 | $0 |
Source: Public Records
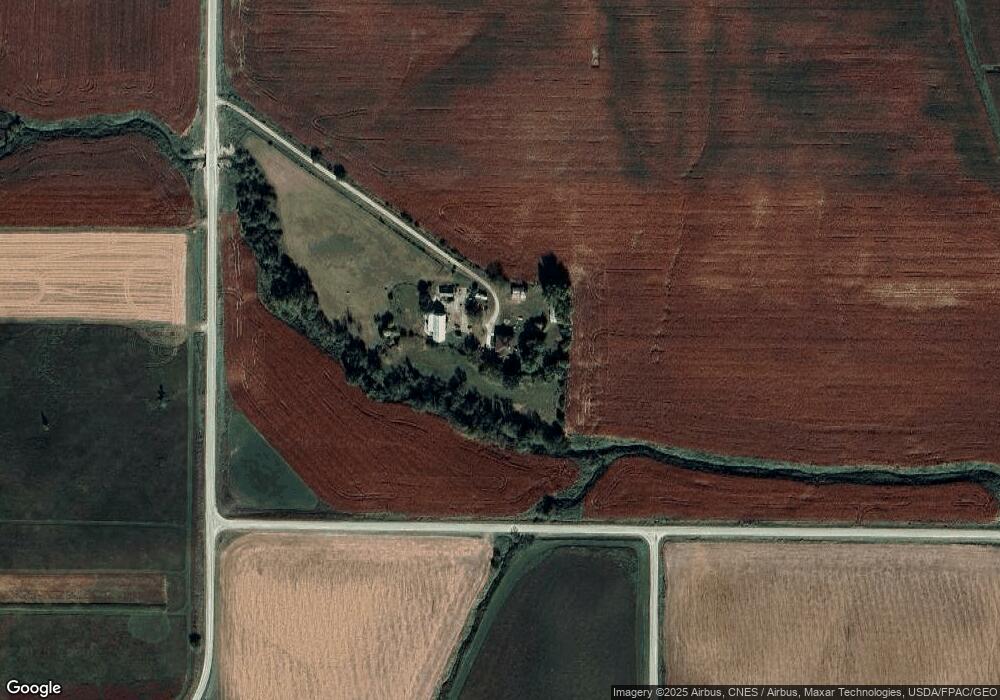
Map
Nearby Homes