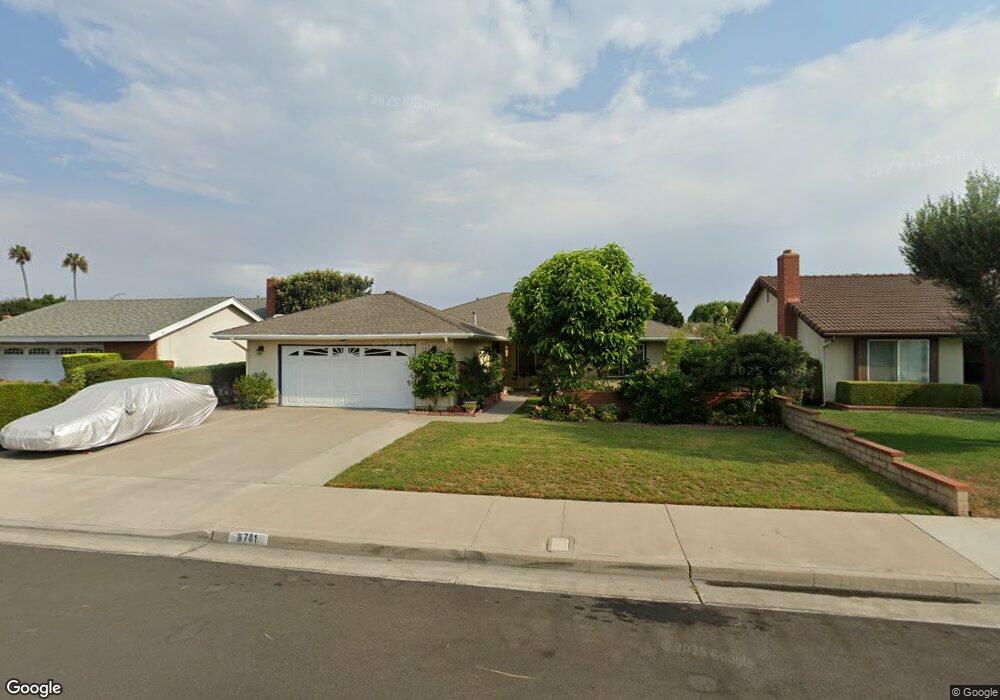
8781 Anthony Dr Huntington Beach, CA 92647
Estimated Value: $1,141,388 - $1,298,000
4
Beds
2
Baths
1,498
Sq Ft
$803/Sq Ft
Est. Value
About This Home
This home is located at 8781 Anthony Dr, Huntington Beach, CA 92647 and is currently estimated at $1,203,347, approximately $803 per square foot. 8781 Anthony Dr is a home located in Orange County with nearby schools including Vista View Middle School, Ocean View High, and Sycamore Creek Community Charter School.
Ownership History
Date
Name
Owned For
Owner Type
Purchase Details
Closed on
Sep 16, 2022
Sold by
Duc Tran Tuan
Bought by
Tuan Tran And Mai Trinh Family Trust
Current Estimated Value
Purchase Details
Closed on
Mar 3, 2020
Sold by
Tran Tuan Duc and Tran Trung Nghia
Bought by
Tran Tuan Duc
Purchase Details
Closed on
Apr 24, 1999
Sold by
Tran Thang Duc and Tran Tuan Duc
Bought by
Tran Tuan Duc and Tran Trung Nghia Duc
Purchase Details
Closed on
Aug 22, 1997
Sold by
Lehman Anna S
Bought by
Tran Thang Duc and Tran Tuan Duc
Home Financials for this Owner
Home Financials are based on the most recent Mortgage that was taken out on this home.
Original Mortgage
$180,000
Interest Rate
7.54%
Purchase Details
Closed on
Oct 20, 1996
Sold by
Logan Michael D and Logan Goergia A
Bought by
Lehman Anna S
Create a Home Valuation Report for This Property
The Home Valuation Report is an in-depth analysis detailing your home's value as well as a comparison with similar homes in the area
Home Values in the Area
Average Home Value in this Area
Purchase History
| Date | Buyer | Sale Price | Title Company |
|---|---|---|---|
| Tuan Tran And Mai Trinh Family Trust | -- | -- | |
| Tran Tuan Duc | -- | First American Title | |
| Tran Tuan Duc | -- | -- | |
| Tran Thang Duc | $203,000 | First American Title Ins Co | |
| Lehman Anna S | -- | First American Title Ins Co |
Source: Public Records
Mortgage History
| Date | Status | Borrower | Loan Amount |
|---|---|---|---|
| Previous Owner | Tran Thang Duc | $180,000 |
Source: Public Records
Tax History Compared to Growth
Tax History
| Year | Tax Paid | Tax Assessment Tax Assessment Total Assessment is a certain percentage of the fair market value that is determined by local assessors to be the total taxable value of land and additions on the property. | Land | Improvement |
|---|---|---|---|---|
| 2025 | $6,628 | $580,861 | $468,180 | $112,681 |
| 2024 | $6,628 | $569,472 | $459,000 | $110,472 |
| 2023 | $6,478 | $558,306 | $450,000 | $108,306 |
| 2022 | $6,383 | $547,359 | $441,176 | $106,183 |
| 2021 | $6,267 | $536,627 | $432,526 | $104,101 |
| 2020 | $3,791 | $312,255 | $207,012 | $105,243 |
| 2019 | $3,728 | $306,133 | $202,953 | $103,180 |
| 2018 | $3,647 | $300,131 | $198,974 | $101,157 |
| 2017 | $3,589 | $294,247 | $195,073 | $99,174 |
| 2016 | $3,447 | $288,478 | $191,248 | $97,230 |
| 2015 | $3,395 | $284,145 | $188,375 | $95,770 |
| 2014 | $3,328 | $278,579 | $184,685 | $93,894 |
Source: Public Records
Map
Nearby Homes
- 16871 Ross Ln
- 16551 Ross Ln
- 16761 Irby Ln
- 17475 Santa Lucia St
- 16781 Scotsdale Cir
- 16782 Heritage Ln
- 16806 Olive St
- 9446 Gardenia Ave
- 8402 Slater Ave
- 17391 Waal Cir
- 8171 Holland Dr
- 17215 Buttonwood St
- 17391 Meer Cir
- 16767 Madrone Cir
- 9485 Geranium Cir
- 17807 Joshua Cir
- 16637 Viewpoint Ln Unit 12D
- 16962 Westwood Ln Unit 14
- 17641 Sergio Cir Unit 203
- 17661 Sergio Cir Unit 103
- 8761 Anthony Dr
- 8791 Anthony Dr
- 16902 Roque Ln
- 8801 Anthony Dr
- 8792 Jarrett Cir
- 8782 Anthony Dr
- 8782 Jarrett Cir
- 8792 Anthony Dr
- 8762 Anthony Dr
- 8762 Jarrett Cir
- 8821 Anthony Dr
- 8802 Jarrett Cir
- 16911 Roque Ln
- 16921 Roque Ln
- 8752 Anthony Dr
- 16901 Roque Ln
- 16931 Roque Ln
- 8822 Jarrett Cir
- 8802 Anthony Dr
- 16891 Roque Ln