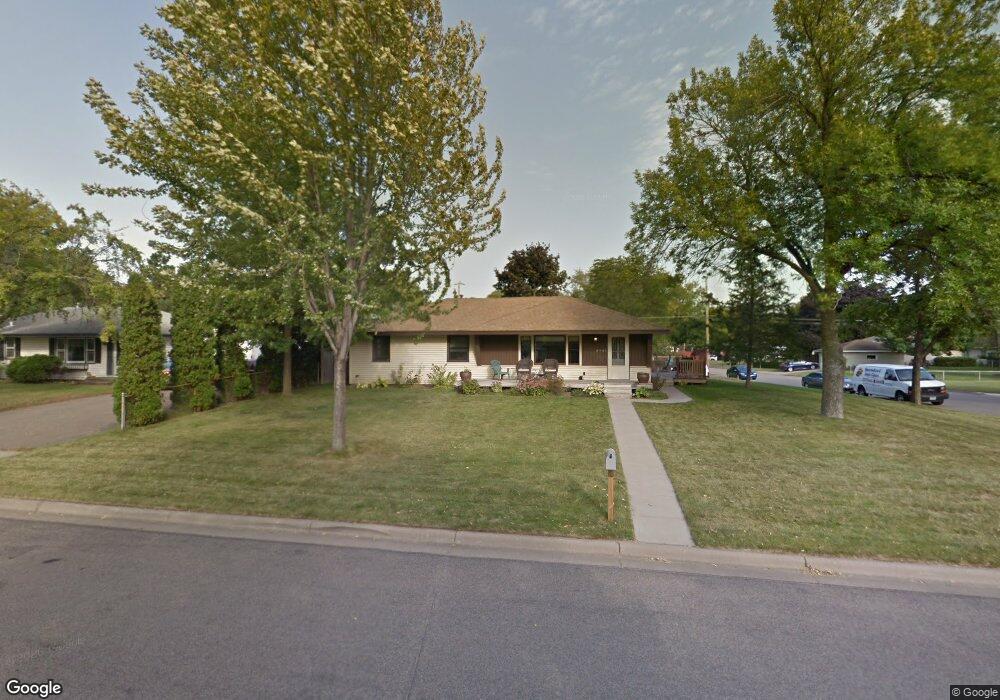
8781 Grospoint Ave S Cottage Grove, MN 55016
Estimated Value: $308,000 - $327,000
4
Beds
3
Baths
1,248
Sq Ft
$256/Sq Ft
Est. Value
About This Home
This home is located at 8781 Grospoint Ave S, Cottage Grove, MN 55016 and is currently estimated at $319,578, approximately $256 per square foot. 8781 Grospoint Ave S is a home located in Washington County with nearby schools including Pine Hill Elementary School, Oltman Middle School, and Park Senior High School.
Ownership History
Date
Name
Owned For
Owner Type
Purchase Details
Closed on
Aug 26, 2021
Sold by
Wiener John F and Wiener Carolyn V
Bought by
Wiener John F and Wiener Shannon M
Current Estimated Value
Home Financials for this Owner
Home Financials are based on the most recent Mortgage that was taken out on this home.
Original Mortgage
$182,000
Outstanding Balance
$138,922
Interest Rate
2.1%
Mortgage Type
New Conventional
Estimated Equity
$180,656
Purchase Details
Closed on
Sep 20, 2017
Sold by
Wiener John F and Wiener Carolyn V
Bought by
Wiener John F
Purchase Details
Closed on
Jun 11, 2004
Sold by
Fleischhacker Rose R A and Fleischhacker Angela M
Bought by
Wiener John F
Purchase Details
Closed on
Nov 26, 1997
Sold by
Estate Of Janice E Fritz
Bought by
Fleischhacker Roger A and Fleischhacker Angela M
Create a Home Valuation Report for This Property
The Home Valuation Report is an in-depth analysis detailing your home's value as well as a comparison with similar homes in the area
Home Values in the Area
Average Home Value in this Area
Purchase History
| Date | Buyer | Sale Price | Title Company |
|---|---|---|---|
| Wiener John F | $225,000 | First Fincl Ttl Agencyof Mn | |
| Wiener John F | -- | None Available | |
| Wienr John F | -- | None Available | |
| Wiener John F | $210,000 | -- | |
| Fleischhacker Roger A | $95,000 | -- | |
| Wiener John John | $225,000 | -- |
Source: Public Records
Mortgage History
| Date | Status | Borrower | Loan Amount |
|---|---|---|---|
| Open | Wiener John F | $182,000 |
Source: Public Records
Tax History Compared to Growth
Tax History
| Year | Tax Paid | Tax Assessment Tax Assessment Total Assessment is a certain percentage of the fair market value that is determined by local assessors to be the total taxable value of land and additions on the property. | Land | Improvement |
|---|---|---|---|---|
| 2024 | $3,744 | $304,300 | $100,000 | $204,300 |
| 2023 | $3,744 | $319,200 | $125,000 | $194,200 |
| 2022 | $3,252 | $295,300 | $114,500 | $180,800 |
| 2021 | $3,078 | $245,300 | $95,100 | $150,200 |
| 2020 | $3,040 | $235,800 | $90,500 | $145,300 |
| 2019 | $2,942 | $226,600 | $82,000 | $144,600 |
| 2018 | $2,774 | $215,300 | $79,000 | $136,300 |
| 2017 | $2,428 | $201,000 | $72,500 | $128,500 |
| 2016 | $2,476 | $181,500 | $55,000 | $126,500 |
| 2015 | $2,080 | $149,100 | $43,600 | $105,500 |
| 2013 | -- | $130,800 | $34,300 | $96,500 |
Source: Public Records
Map
Nearby Homes
- 8843 Grospoint Ave S
- 8633 Grospoint Ave S
- 8833 Hallmark Ave S
- 6911 92nd St S
- 8392 Greene Ave S
- 9325 Harkness Ave S
- 6699 93rd Alcove S
- 10406 Glenbrook Ave S
- 10502 Glenbrook Ave S
- 10442 Glenbrook Ave S
- 10503 Glenbrook Ave S
- 9457 Hames Ave S
- 8012 Scott Blvd
- 1712 Selby Ave
- 8499 Heron Ave S
- 8222 Hames Rd S
- 1601 14th Ave
- 8459 Hilo Trail S
- 9763 Dunes Ln
- 6603 97th Ct S
- 8765 Grospoint Ave S
- 8766 Hadley Ave S
- 8801 Grospoint Ave S
- 8750 Hadley Ave S
- 8739 Grospoint Ave S
- 8798 Hadley Ave S
- 8784 Grospoint Ave S
- 8770 Grospoint Ave S
- 8815 Grospoint Ave S
- 8744 Hadley Ave S
- 8754 Grospoint Ave S
- 8810 Hadley Ave S
- 8723 Grospoint Ave S
- 8804 Grospoint Ave S
- 8728 Hadley Ave S
- 8829 Grospoint Ave S
- 8818 Grospoint Ave S
- 8822 Hadley Ave S
- 8707 Grospoint Ave S
- 8763 Greystone Ave S