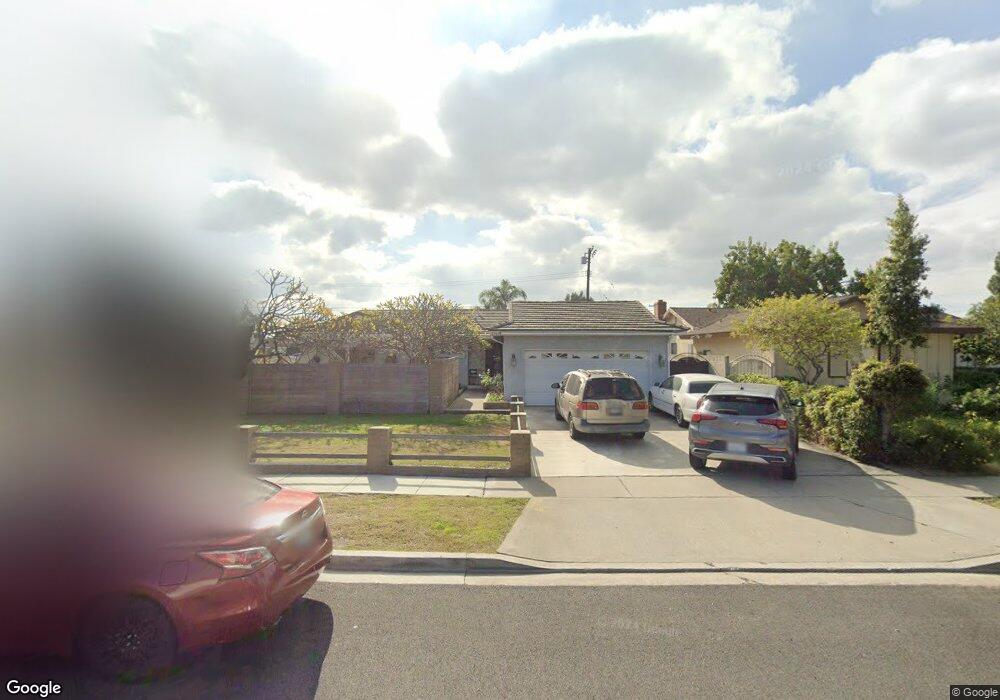
8782 Mays Ave Garden Grove, CA 92844
Estimated Value: $1,158,000 - $1,337,000
4
Beds
3
Baths
2,071
Sq Ft
$594/Sq Ft
Est. Value
About This Home
This home is located at 8782 Mays Ave, Garden Grove, CA 92844 and is currently estimated at $1,229,704, approximately $593 per square foot. 8782 Mays Ave is a home located in Orange County with nearby schools including Anderson Elementary School, Warner Middle, and Westminster High School.
Ownership History
Date
Name
Owned For
Owner Type
Purchase Details
Closed on
Mar 16, 2023
Sold by
Gurrola-Holther Ofelia
Bought by
Ofelia Gurrola-Holther Trust
Current Estimated Value
Purchase Details
Closed on
Feb 17, 2023
Sold by
David Richard Holther and David Ofelia Gurrola-H
Bought by
Gurrola-Holther Ofelia
Purchase Details
Closed on
Aug 25, 2022
Sold by
Richard Holther David and Richard Ofelia
Bought by
David Richard Holther & Ofelia Gurrola-Holthe
Purchase Details
Closed on
Feb 25, 1998
Sold by
Kent Bryant Naze and Kent Ruth P
Bought by
Carr Olivia N and Holther David R
Home Financials for this Owner
Home Financials are based on the most recent Mortgage that was taken out on this home.
Original Mortgage
$164,000
Interest Rate
7%
Purchase Details
Closed on
Jan 6, 1995
Sold by
Bryant Luella Kay
Bought by
Bryant Luella Kay and Bryant Naze Kent
Create a Home Valuation Report for This Property
The Home Valuation Report is an in-depth analysis detailing your home's value as well as a comparison with similar homes in the area
Home Values in the Area
Average Home Value in this Area
Purchase History
| Date | Buyer | Sale Price | Title Company |
|---|---|---|---|
| Ofelia Gurrola-Holther Trust | -- | -- | |
| Gurrola-Holther Ofelia | -- | -- | |
| David Richard Holther & Ofelia Gurrola-Holthe | -- | -- | |
| Carr Olivia N | $217,000 | -- | |
| Bryant Luella Kay | -- | -- |
Source: Public Records
Mortgage History
| Date | Status | Borrower | Loan Amount |
|---|---|---|---|
| Previous Owner | Carr Olivia N | $164,000 |
Source: Public Records
Tax History Compared to Growth
Tax History
| Year | Tax Paid | Tax Assessment Tax Assessment Total Assessment is a certain percentage of the fair market value that is determined by local assessors to be the total taxable value of land and additions on the property. | Land | Improvement |
|---|---|---|---|---|
| 2025 | $4,824 | $346,474 | $225,548 | $120,926 |
| 2024 | $4,824 | $339,681 | $221,126 | $118,555 |
| 2023 | $4,662 | $333,021 | $216,790 | $116,231 |
| 2022 | $4,495 | $326,492 | $212,540 | $113,952 |
| 2021 | $4,400 | $320,091 | $208,373 | $111,718 |
| 2020 | $4,348 | $316,809 | $206,236 | $110,573 |
| 2019 | $4,258 | $310,598 | $202,193 | $108,405 |
| 2018 | $4,242 | $304,508 | $198,228 | $106,280 |
| 2017 | $4,086 | $298,538 | $194,341 | $104,197 |
| 2016 | $3,933 | $292,685 | $190,531 | $102,154 |
| 2015 | $3,862 | $288,289 | $187,669 | $100,620 |
| 2014 | $3,778 | $282,642 | $183,993 | $98,649 |
Source: Public Records
Map
Nearby Homes
- 8784 Hewitt Place Unit 12
- 13711 Magnolia St
- 13839 Magnolia St
- 13782 Newland St
- 13411 Magnolia St
- 8442 Trask Ave
- 9200 Westminster Blvd Unit 25
- 13392 Magnolia St
- 8866 Grandville Cir
- 8569 Edgebrook Dr
- 13252 Newland St Unit A-D
- 8202 19th St
- 8902 Mcclure Ave
- 8196 18th St
- 8197 Jasmine Ave
- 8520 Lake Knoll Ave Unit B
- 13175 Creek View Dr Unit F
- 14431 Nola St
- 13502 Jackson St
- 8833 Brookdale Dr