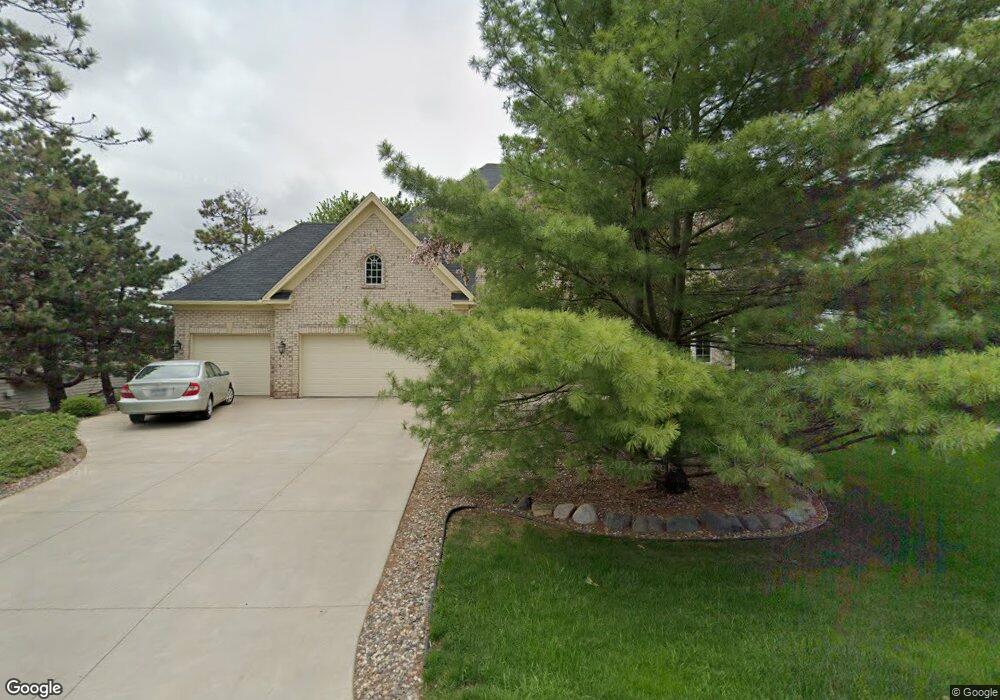
8782 Pheasant Run Rd Woodbury, MN 55125
Estimated Value: $586,000 - $623,315
5
Beds
4
Baths
2,759
Sq Ft
$220/Sq Ft
Est. Value
About This Home
This home is located at 8782 Pheasant Run Rd, Woodbury, MN 55125 and is currently estimated at $607,579, approximately $220 per square foot. 8782 Pheasant Run Rd is a home located in Washington County with nearby schools including Woodbury Elementary School, Woodbury Middle School, and Woodbury Senior High School.
Ownership History
Date
Name
Owned For
Owner Type
Purchase Details
Closed on
Sep 16, 2021
Sold by
Opendoor Property Trust
Bought by
Barba Nathan J and Barba Melaney
Current Estimated Value
Home Financials for this Owner
Home Financials are based on the most recent Mortgage that was taken out on this home.
Original Mortgage
$325,000
Outstanding Balance
$295,726
Interest Rate
2.8%
Mortgage Type
New Conventional
Estimated Equity
$311,853
Purchase Details
Closed on
May 28, 2021
Sold by
Jesus Silva and Jesus Alessandra
Bought by
Opendoor Property Trust
Purchase Details
Closed on
Jan 30, 2014
Sold by
Tobler Carlos E and Amengual Tobler Lir
Bought by
Silva Vinicius
Home Financials for this Owner
Home Financials are based on the most recent Mortgage that was taken out on this home.
Original Mortgage
$40,500
Interest Rate
4.49%
Mortgage Type
Credit Line Revolving
Create a Home Valuation Report for This Property
The Home Valuation Report is an in-depth analysis detailing your home's value as well as a comparison with similar homes in the area
Home Values in the Area
Average Home Value in this Area
Purchase History
| Date | Buyer | Sale Price | Title Company |
|---|---|---|---|
| Barba Nathan J | $553,000 | North American Title Co | |
| Opendoor Property Trust | $561,200 | North American Title | |
| Silva Vinicius | $405,000 | Burnet Title | |
| -- | $561,200 | -- |
Source: Public Records
Mortgage History
| Date | Status | Borrower | Loan Amount |
|---|---|---|---|
| Open | Barba Nathan J | $325,000 | |
| Previous Owner | Silva Vinicius | $40,500 | |
| Previous Owner | Silva Vinicius | $324,000 |
Source: Public Records
Tax History Compared to Growth
Tax History
| Year | Tax Paid | Tax Assessment Tax Assessment Total Assessment is a certain percentage of the fair market value that is determined by local assessors to be the total taxable value of land and additions on the property. | Land | Improvement |
|---|---|---|---|---|
| 2024 | $7,962 | $606,500 | $130,000 | $476,500 |
| 2023 | $7,962 | $641,700 | $173,000 | $468,700 |
| 2022 | $6,374 | $572,500 | $138,000 | $434,500 |
| 2021 | $6,428 | $477,100 | $115,000 | $362,100 |
| 2020 | $6,444 | $468,100 | $110,000 | $358,100 |
| 2019 | $6,472 | $459,800 | $97,500 | $362,300 |
| 2018 | $6,500 | $444,400 | $100,000 | $344,400 |
| 2017 | $6,432 | $439,500 | $100,000 | $339,500 |
| 2016 | $6,908 | $441,600 | $95,000 | $346,600 |
| 2015 | $5,928 | $454,600 | $95,000 | $359,600 |
| 2013 | -- | $393,100 | $65,200 | $327,900 |
Source: Public Records
Map
Nearby Homes
- 1438 Corral Ln
- 8764 Pinehurst Bay
- 1322 Bridle Path Ct
- 1311 Fallbrook Ln
- 1329 Carriage Rd
- 1825 Donegal Dr Unit 1
- 1731 Donegal Dr
- 1414 Interlachen Cir
- 1870 Donegal Dr Unit 4
- 1865 Donegal Dr Unit 2
- 1865 Donegal Dr Unit 3
- 1283 Donegal Bay
- 1616 Wexford Way
- 936 Winterberry Dr
- 1165 Autumn Dr
- 8138 Somerset Rd
- 9419 Mcintosh Rd
- 8980 Highland Cir
- 1636 Spinaker Dr
- 2084 Parkview Ln
- 1484 Corral Ln
- 8798 Pheasant Run Rd
- 1474 Corral Ln
- 8754 Pheasant Run Rd
- 1546 Corral Ln
- 1491 Corral Alcove
- 8767 Pheasant Run Rd
- 8740 Pheasant Run Rd
- 8814 Pheasant Run Rd
- 1462 Corral Ln
- 8753 Pheasant Run Rd
- 8801 Pheasant Run Rd
- 1554 Corral Ln
- 1475 Corral Ln
- 1489 Corral Alcove
- 8739 Pheasant Run Rd
- 8726 Pheasant Run Rd
- 8830 Pheasant Run Rd
- 8815 Pheasant Run Rd
- 1450 Corral Ln