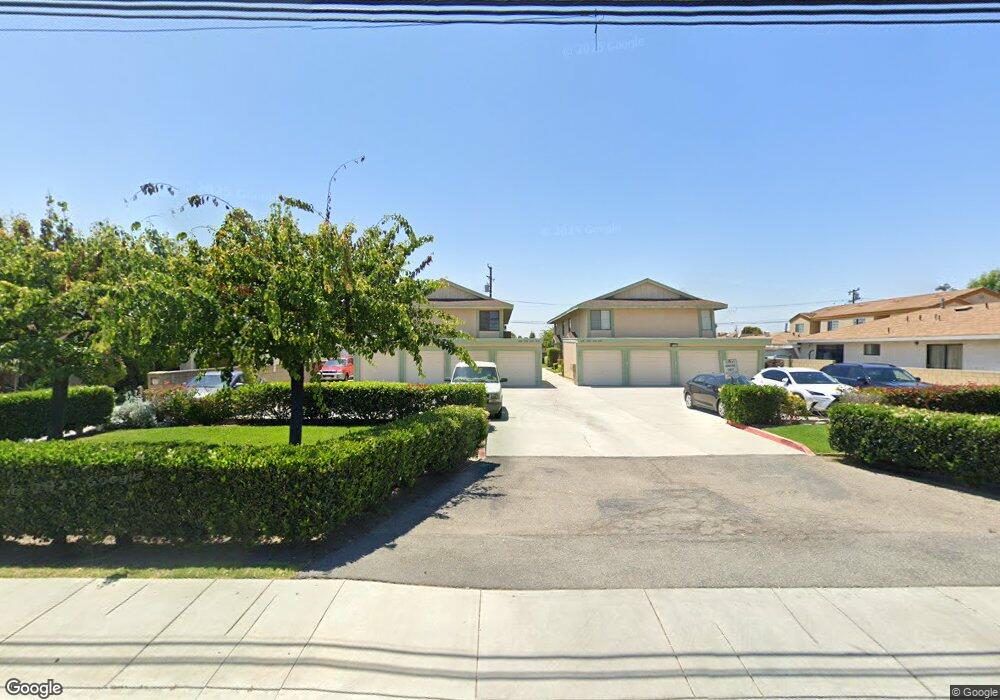
8783 Moody St Unit 2 Cypress, CA 90630
Estimated Value: $584,315 - $634,000
2
Beds
2
Baths
1,019
Sq Ft
$603/Sq Ft
Est. Value
About This Home
This home is located at 8783 Moody St Unit 2, Cypress, CA 90630 and is currently estimated at $614,579, approximately $603 per square foot. 8783 Moody St Unit 2 is a home located in Orange County with nearby schools including Clara J. King Elementary School, Walker Junior High School, and John F. Kennedy High School.
Ownership History
Date
Name
Owned For
Owner Type
Purchase Details
Closed on
Jul 30, 2025
Sold by
Han Xiang Simon and Niu Qian
Bought by
Han And Niu Family Trust and Han
Current Estimated Value
Purchase Details
Closed on
Jan 28, 2022
Sold by
Qian Niu
Bought by
Han Xiang Simon and Niu Qian
Purchase Details
Closed on
Aug 2, 2010
Sold by
Poore Hosea and Zoucha Theresa
Bought by
Niu Qian
Home Financials for this Owner
Home Financials are based on the most recent Mortgage that was taken out on this home.
Original Mortgage
$172,550
Interest Rate
4.51%
Mortgage Type
New Conventional
Purchase Details
Closed on
Dec 7, 2005
Sold by
8781 Moody Llc
Bought by
Poore Hosea and Zoucha Theresa
Home Financials for this Owner
Home Financials are based on the most recent Mortgage that was taken out on this home.
Original Mortgage
$295,200
Interest Rate
6.25%
Mortgage Type
New Conventional
Create a Home Valuation Report for This Property
The Home Valuation Report is an in-depth analysis detailing your home's value as well as a comparison with similar homes in the area
Home Values in the Area
Average Home Value in this Area
Purchase History
| Date | Buyer | Sale Price | Title Company |
|---|---|---|---|
| Han And Niu Family Trust | -- | None Listed On Document | |
| Han Xiang Simon | -- | None Listed On Document | |
| Niu Qian | $246,500 | Lawyers Title | |
| Poore Hosea | $369,000 | Commonwealth Land Title Co |
Source: Public Records
Mortgage History
| Date | Status | Borrower | Loan Amount |
|---|---|---|---|
| Previous Owner | Niu Qian | $172,550 | |
| Previous Owner | Poore Hosea | $295,200 |
Source: Public Records
Tax History Compared to Growth
Tax History
| Year | Tax Paid | Tax Assessment Tax Assessment Total Assessment is a certain percentage of the fair market value that is determined by local assessors to be the total taxable value of land and additions on the property. | Land | Improvement |
|---|---|---|---|---|
| 2025 | $3,749 | $315,805 | $213,189 | $102,616 |
| 2024 | $3,749 | $309,613 | $209,009 | $100,604 |
| 2023 | $3,662 | $303,543 | $204,911 | $98,632 |
| 2022 | $3,617 | $297,592 | $200,893 | $96,699 |
| 2021 | $3,570 | $291,757 | $196,954 | $94,803 |
| 2020 | $3,555 | $288,766 | $194,935 | $93,831 |
| 2019 | $3,460 | $283,104 | $191,112 | $91,992 |
| 2018 | $3,414 | $277,553 | $187,364 | $90,189 |
| 2017 | $3,300 | $272,111 | $183,690 | $88,421 |
| 2016 | $3,272 | $266,776 | $180,088 | $86,688 |
| 2015 | $3,248 | $262,769 | $177,383 | $85,386 |
| 2014 | $3,006 | $257,622 | $173,908 | $83,714 |
Source: Public Records
Map
Nearby Homes
- 8742 La Salle St
- 4891 Grace Ave
- 4842 Sapphire Way
- 8606 Belmont St
- 4617 Alekona Ct
- 9051 Cobblestone Ln Unit 40
- 4823 Fieldbrook Ln Unit 24
- 9122 Windsor Cir
- 8312 Bellhaven St
- 5275 Vista Real
- 8292 Bellhaven St
- 8342 Fontainbleau Way
- 8161 Suffield St
- 5572 Saint Ann Ave
- 5000 Clementine Ln
- 6007 Clementine Ln Unit 21
- Plan A1 at Citrus Square - Cerise
- Plan A2 at Citrus Square - Cerise
- 9001 Cerise Ln Unit 109
- 9001 Cerise Ln Unit 113
- 8783 Moody St
- 8785 Moody St Unit 3
- 8787 Moody St Unit 4
- 8791 Moody St Unit 8
- 8795 Moody St Unit 6
- 8795 Moody St
- 8797 Moody St
- 8781 Moody St Unit 1
- 8793 Moody St
- 8803 Moody St
- 8791 Belday St
- 8773 Moody St
- 8801 Belday St
- 8811 Moody St
- 5011 New York Ave
- 8805 Moody St
- 8811 Belday St
- 8821 Moody St
- 8831 Moody St
- 8751 Moody St