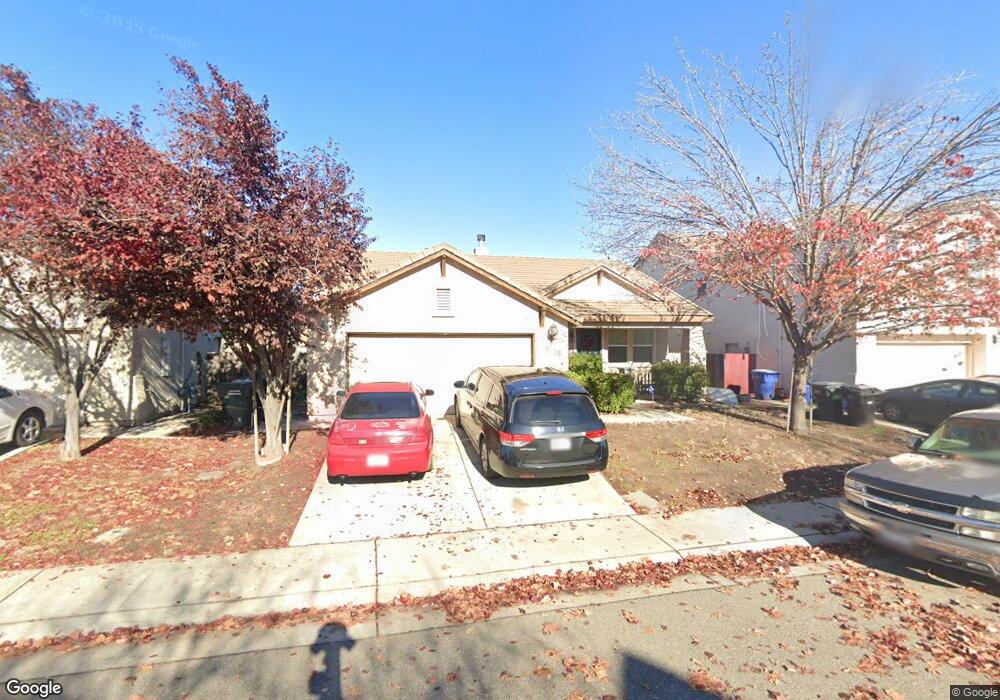
8786 Ardith Dr Sacramento, CA 95828
Estimated Value: $413,000 - $596,000
3
Beds
2
Baths
1,713
Sq Ft
$301/Sq Ft
Est. Value
About This Home
This home is located at 8786 Ardith Dr, Sacramento, CA 95828 and is currently estimated at $516,017, approximately $301 per square foot. 8786 Ardith Dr is a home located in Sacramento County with nearby schools including Raymond Case Elementary School, Edward Harris Jr. Middle School, and Monterey Trail High School.
Ownership History
Date
Name
Owned For
Owner Type
Purchase Details
Closed on
Jun 21, 2021
Sold by
Le David Toan and Estate Of Ben Binh Le
Bought by
Le Jimmy Tai and Estate Of Ben Binh Le
Current Estimated Value
Purchase Details
Closed on
Aug 1, 2003
Sold by
Parkland Homes Inc
Bought by
Le Ben B
Home Financials for this Owner
Home Financials are based on the most recent Mortgage that was taken out on this home.
Original Mortgage
$181,615
Outstanding Balance
$77,350
Interest Rate
5.17%
Mortgage Type
Purchase Money Mortgage
Estimated Equity
$438,667
Purchase Details
Closed on
Jul 25, 2003
Sold by
Nguyen Minh Thi
Bought by
Le Ben B
Home Financials for this Owner
Home Financials are based on the most recent Mortgage that was taken out on this home.
Original Mortgage
$181,615
Outstanding Balance
$77,350
Interest Rate
5.17%
Mortgage Type
Purchase Money Mortgage
Estimated Equity
$438,667
Create a Home Valuation Report for This Property
The Home Valuation Report is an in-depth analysis detailing your home's value as well as a comparison with similar homes in the area
Home Values in the Area
Average Home Value in this Area
Purchase History
| Date | Buyer | Sale Price | Title Company |
|---|---|---|---|
| Le Jimmy Tai | -- | None Available | |
| Le Ben B | $260,500 | First American Title Co | |
| Le Ben B | -- | First American Title Co |
Source: Public Records
Mortgage History
| Date | Status | Borrower | Loan Amount |
|---|---|---|---|
| Open | Le Ben B | $181,615 |
Source: Public Records
Tax History Compared to Growth
Tax History
| Year | Tax Paid | Tax Assessment Tax Assessment Total Assessment is a certain percentage of the fair market value that is determined by local assessors to be the total taxable value of land and additions on the property. | Land | Improvement |
|---|---|---|---|---|
| 2025 | $4,102 | $370,196 | $63,968 | $306,228 |
| 2024 | $4,102 | $362,938 | $62,714 | $300,224 |
| 2023 | $4,001 | $355,823 | $61,485 | $294,338 |
| 2022 | $3,935 | $348,847 | $60,280 | $288,567 |
| 2021 | $3,892 | $342,008 | $59,099 | $282,909 |
| 2020 | $3,841 | $338,503 | $58,494 | $280,009 |
| 2019 | $3,773 | $331,867 | $57,348 | $274,519 |
| 2018 | $3,564 | $314,869 | $54,411 | $260,458 |
| 2017 | $3,352 | $294,271 | $50,852 | $243,419 |
| 2016 | $3,025 | $272,474 | $47,086 | $225,388 |
| 2015 | $2,761 | $247,705 | $42,806 | $204,899 |
| 2014 | $2,625 | $233,684 | $40,383 | $193,301 |
Source: Public Records
Map
Nearby Homes
- 8643 Rothenburg Ct
- 8578 Hydrangea Ct
- 8541 Lupin Way
- 8772 Crusheen Way
- 8831 Liscarney Way
- 8216 Exbourne Cir
- 8836 Inisheer Way
- 8233 Short Rd
- 8805 Coral Berry Way
- 8809 Coral Berry Way
- 8159 Morgan Hill Way
- 8447 Cassatt Way
- 8170 Derbyshire Cir
- 8247 Derbyshire Cir
- 8788 Apricot Woods Way
- 8902 Cobble Crest Dr
- 8906 Cobble Crest Dr
- 8659 Tegea Way
- 8609 Aviary Woods Way
- 8269 Red Rock Dr
- 8782 Ardith Dr
- 8790 Ardith Dr
- 8814 Ardith Dr
- 8778 Ardith Dr
- 8648 Chambord Ct
- 8818 Ardith Dr
- 8652 Chambord Ct
- 8787 Ardith Dr
- 8783 Ardith Dr
- 8774 Ardith Dr
- 8791 Ardith Dr
- 8779 Ardith Dr
- 8811 Ardith Dr
- 8385 Linderhof Way
- 8815 Ardith Dr
- 8807 Ardith Dr
- 8656 Chambord Ct
- 8799 Ardith Dr
- 8770 Ardith Dr
- 8775 Ardith Dr