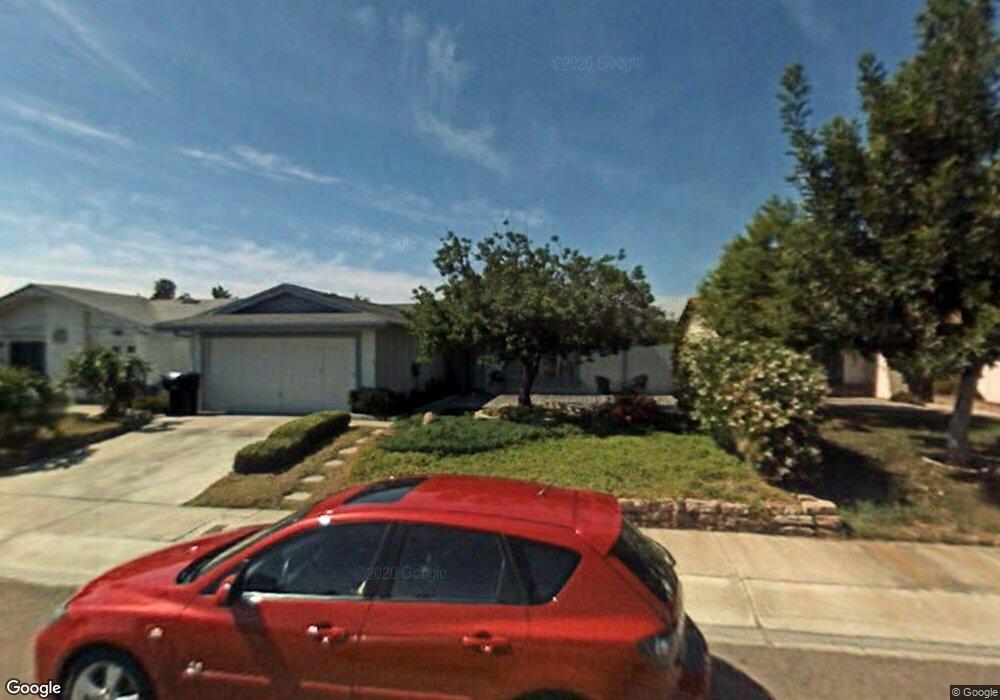
8786 Pagoda Way San Diego, CA 92126
Mira Mesa NeighborhoodEstimated Value: $924,708 - $1,077,000
4
Beds
2
Baths
1,320
Sq Ft
$755/Sq Ft
Est. Value
About This Home
This home is located at 8786 Pagoda Way, San Diego, CA 92126 and is currently estimated at $996,177, approximately $754 per square foot. 8786 Pagoda Way is a home located in San Diego County with nearby schools including Walker Elementary School, Wangenheim Middle School, and Mira Mesa High School.
Ownership History
Date
Name
Owned For
Owner Type
Purchase Details
Closed on
Aug 13, 2022
Sold by
Minh Truong Hung
Bought by
Truong Nguyen Trust
Current Estimated Value
Purchase Details
Closed on
Apr 18, 2003
Sold by
Nguyen Oanh Kim
Bought by
Truong Hung and Nguyen Oanh Kim
Purchase Details
Closed on
Apr 3, 2002
Sold by
Truong Hung M
Bought by
Nguyen Oanh Kim
Home Financials for this Owner
Home Financials are based on the most recent Mortgage that was taken out on this home.
Original Mortgage
$241,600
Interest Rate
6.29%
Purchase Details
Closed on
Feb 21, 2002
Sold by
Schrader Fernando A and Schrader Ana M
Bought by
Nguyen Oanh Kim
Home Financials for this Owner
Home Financials are based on the most recent Mortgage that was taken out on this home.
Original Mortgage
$241,600
Interest Rate
6.29%
Purchase Details
Closed on
Dec 6, 2001
Sold by
Schrader Fernando A and Schrader Ana M
Bought by
Schrader Fernando A and Schrader Ana M
Create a Home Valuation Report for This Property
The Home Valuation Report is an in-depth analysis detailing your home's value as well as a comparison with similar homes in the area
Home Values in the Area
Average Home Value in this Area
Purchase History
| Date | Buyer | Sale Price | Title Company |
|---|---|---|---|
| Truong Nguyen Trust | -- | -- | |
| Truong Hung | -- | -- | |
| Nguyen Oanh Kim | -- | Fidelity National Title | |
| Nguyen Oanh Kim | $302,000 | Fidelity National Title | |
| Schrader Fernando A | -- | -- |
Source: Public Records
Mortgage History
| Date | Status | Borrower | Loan Amount |
|---|---|---|---|
| Previous Owner | Nguyen Oanh Kim | $241,600 |
Source: Public Records
Tax History Compared to Growth
Tax History
| Year | Tax Paid | Tax Assessment Tax Assessment Total Assessment is a certain percentage of the fair market value that is determined by local assessors to be the total taxable value of land and additions on the property. | Land | Improvement |
|---|---|---|---|---|
| 2025 | $5,424 | $446,123 | $332,381 | $113,742 |
| 2024 | $5,424 | $437,376 | $325,864 | $111,512 |
| 2023 | $5,304 | $428,801 | $319,475 | $109,326 |
| 2022 | $5,162 | $420,394 | $313,211 | $107,183 |
| 2021 | $5,126 | $412,152 | $307,070 | $105,082 |
| 2020 | $5,064 | $407,927 | $303,922 | $104,005 |
| 2019 | $4,974 | $399,929 | $297,963 | $101,966 |
| 2018 | $4,652 | $392,088 | $292,121 | $99,967 |
| 2017 | $4,538 | $384,401 | $286,394 | $98,007 |
| 2016 | $4,465 | $376,865 | $280,779 | $96,086 |
| 2015 | $4,400 | $371,205 | $276,562 | $94,643 |
| 2014 | $4,331 | $363,935 | $271,145 | $92,790 |
Source: Public Records
Map
Nearby Homes
- 10573 Caminito Flores
- 10422 Londonderry Ave
- 8516 Flanders Dr
- 10265 Eagle Rock Ave
- 10582 Caminito Glenellen
- 8670 New Salem St Unit 106
- 8650 New Salem St Unit 27
- 8644 New Salem St Unit 6
- 8654 New Salem St Unit 44
- 10284 Black Mountain Rd Unit 198
- 14331 Montano Way
- 14341 Montano Way
- 14659 Dunleer Way
- 14633 Dunleer Way
- 14665 Dunleer Way
- 14641 Dunleer Way
- 10296 Black Mountain Rd Unit 220
- 10258 Black Mountain Rd Unit 145
- 10222 Black Mountain Rd Unit 69
- 8727 Westmore Rd Unit 24
- 8776 Pagoda Way
- 8796 Pagoda Way
- 8766 Pagoda Way
- 8806 Pagoda Way
- 8795 Belfast Cir
- 8775 Belfast Cir
- 8805 Belfast Cir
- 8765 Belfast Cir
- 8787 Pagoda Way
- 8756 Pagoda Way
- 8777 Pagoda Way
- 8797 Pagoda Way
- 8767 Pagoda Way
- 8815 Belfast Cir
- 8755 Belfast Cir
- 8805 Pagoda Way
- 8826 Pagoda Way
- 8757 Pagoda Way
- 8815 Pagoda Way
- 8825 Belfast Cir