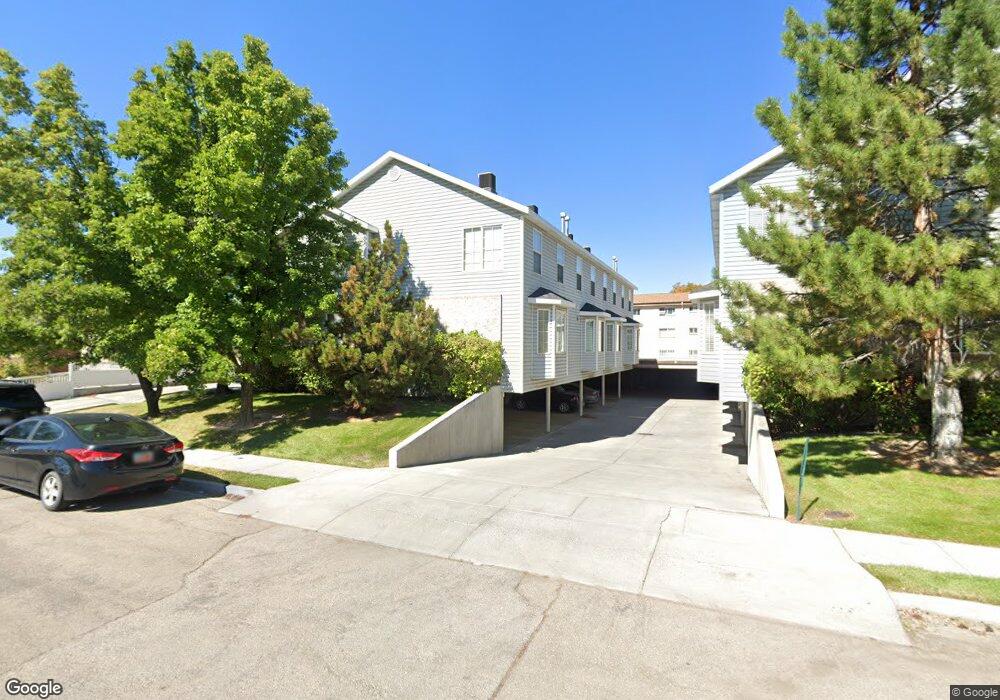
879 E 350 N Provo, UT 84606
Joaquin NeighborhoodEstimated Value: $441,997 - $460,000
4
Beds
2
Baths
1,220
Sq Ft
$368/Sq Ft
Est. Value
About This Home
This home is located at 879 E 350 N, Provo, UT 84606 and is currently estimated at $448,666, approximately $367 per square foot. 879 E 350 N is a home located in Utah County with nearby schools including Provo Peaks School, Centennial Middle School, and Timpview High School.
Ownership History
Date
Name
Owned For
Owner Type
Purchase Details
Closed on
Oct 14, 2022
Sold by
Westover Michael J
Bought by
Richards Management Holdings Llc
Current Estimated Value
Purchase Details
Closed on
Jun 4, 2020
Sold by
Westover Mike and Westover Kevin
Bought by
Westover Michael J and Westover Brittani
Home Financials for this Owner
Home Financials are based on the most recent Mortgage that was taken out on this home.
Original Mortgage
$243,750
Interest Rate
3.25%
Mortgage Type
New Conventional
Purchase Details
Closed on
Mar 3, 2016
Sold by
Hedberg Richard G and Hedberg Georgette I
Bought by
Westover Mike and Westover Kevin J
Home Financials for this Owner
Home Financials are based on the most recent Mortgage that was taken out on this home.
Original Mortgage
$168,750
Interest Rate
3.79%
Mortgage Type
New Conventional
Create a Home Valuation Report for This Property
The Home Valuation Report is an in-depth analysis detailing your home's value as well as a comparison with similar homes in the area
Home Values in the Area
Average Home Value in this Area
Purchase History
| Date | Buyer | Sale Price | Title Company |
|---|---|---|---|
| Richards Management Holdings Llc | -- | Us Title | |
| Westover Michael J | -- | Mortgage Connect Lp | |
| Westover Michael J | -- | None Available | |
| Westover Micheal J | -- | Mortgage Connect Lp | |
| Westover Mike | -- | Old Republic Title |
Source: Public Records
Mortgage History
| Date | Status | Borrower | Loan Amount |
|---|---|---|---|
| Previous Owner | Westover Michael J | $243,750 | |
| Previous Owner | Westover Mike | $168,750 |
Source: Public Records
Tax History
| Year | Tax Paid | Tax Assessment Tax Assessment Total Assessment is a certain percentage of the fair market value that is determined by local assessors to be the total taxable value of land and additions on the property. | Land | Improvement |
|---|---|---|---|---|
| 2025 | $2,144 | $229,900 | -- | -- |
| 2024 | $2,106 | $211,090 | $0 | $0 |
| 2023 | $2,106 | $204,325 | $0 | $0 |
| 2022 | $2,159 | $211,255 | $0 | $0 |
| 2021 | $1,815 | $309,800 | $37,200 | $272,600 |
| 2020 | $1,790 | $286,400 | $34,400 | $252,000 |
| 2019 | $1,558 | $259,200 | $29,000 | $230,200 |
| 2018 | $1,422 | $240,000 | $29,000 | $211,000 |
| 2017 | $1,211 | $112,310 | $0 | $0 |
| 2016 | $1,203 | $104,005 | $0 | $0 |
| 2015 | $1,145 | $99,990 | $0 | $0 |
| 2014 | $1,098 | $99,990 | $0 | $0 |
Source: Public Records
Map
Nearby Homes
- 879 E 350 N
- 879 E 350 N
- 879 E 350 N
- 879 E 350 N Unit 9
- 879 E 350 N Unit 8
- 879 E 350 N Unit 7
- 879 E 350 N Unit 6
- 885 E 350 N
- 885 E 350 N
- 885 E 350 N
- 885 E 350 N
- 885 E 350 N
- 885 E 350 N
- 885 E 350 N Unit 3
- 885 E 350 N Unit 2
- 885 E 350 N Unit 4
- 885 E 350 N Unit 5
- 885 E 350 N Unit 1
- 851 E 350 N
- 839 E 350 N
Your Personal Tour Guide
Ask me questions while you tour the home.