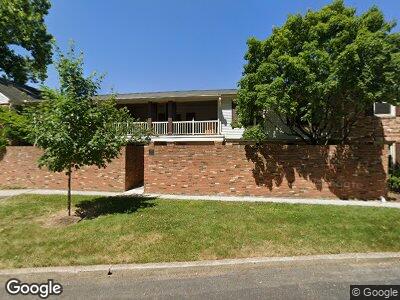
879 Manor Ln Unit 879F Columbus, OH 43221
Cranbrook NeighborhoodEstimated Value: $194,304 - $205,000
2
Beds
2
Baths
1,050
Sq Ft
$188/Sq Ft
Est. Value
About This Home
This home is located at 879 Manor Ln Unit 879F, Columbus, OH 43221 and is currently estimated at $197,826, approximately $188 per square foot. 879 Manor Ln Unit 879F is a home located in Franklin County with nearby schools including Cranbrook Elementary School, Ridgeview Middle School, and Centennial High School.
Ownership History
Date
Name
Owned For
Owner Type
Purchase Details
Closed on
Jun 15, 2004
Sold by
Leonard Donald R and Leonard Susan D
Bought by
Smith Adam
Current Estimated Value
Home Financials for this Owner
Home Financials are based on the most recent Mortgage that was taken out on this home.
Original Mortgage
$72,800
Interest Rate
6.37%
Mortgage Type
Purchase Money Mortgage
Purchase Details
Closed on
Aug 9, 1999
Sold by
Jihanian Sarkis M
Bought by
Leonard Donald R and Leonard Susan D
Home Financials for this Owner
Home Financials are based on the most recent Mortgage that was taken out on this home.
Original Mortgage
$50,000
Interest Rate
7.77%
Purchase Details
Closed on
Jun 7, 1982
Bought by
Jihanian Sarkis M
Create a Home Valuation Report for This Property
The Home Valuation Report is an in-depth analysis detailing your home's value as well as a comparison with similar homes in the area
Home Values in the Area
Average Home Value in this Area
Purchase History
| Date | Buyer | Sale Price | Title Company |
|---|---|---|---|
| Smith Adam | $104,000 | -- | |
| Leonard Donald R | $75,000 | Franklin Abstract | |
| Jihanian Sarkis M | -- | -- |
Source: Public Records
Mortgage History
| Date | Status | Borrower | Loan Amount |
|---|---|---|---|
| Open | Smith Adam | $118,860 | |
| Closed | Smith Adam | $25,000 | |
| Closed | Smith Adam | $95,670 | |
| Closed | Smith Adam | $45,500 | |
| Closed | Smith Adam | $31,200 | |
| Closed | Smith Adam | $72,800 | |
| Previous Owner | Leonard Donald R | $50,000 | |
| Closed | Smith Adam | $31,200 |
Source: Public Records
Tax History Compared to Growth
Tax History
| Year | Tax Paid | Tax Assessment Tax Assessment Total Assessment is a certain percentage of the fair market value that is determined by local assessors to be the total taxable value of land and additions on the property. | Land | Improvement |
|---|---|---|---|---|
| 2024 | $3,975 | $59,300 | $12,780 | $46,520 |
| 2023 | $2,627 | $59,290 | $12,775 | $46,515 |
| 2022 | $2,068 | $39,870 | $5,040 | $34,830 |
| 2021 | $2,072 | $39,870 | $5,040 | $34,830 |
| 2020 | $2,074 | $39,870 | $5,040 | $34,830 |
| 2019 | $2,015 | $33,220 | $4,200 | $29,020 |
| 2018 | $1,974 | $33,220 | $4,200 | $29,020 |
| 2017 | $2,074 | $33,220 | $4,200 | $29,020 |
| 2016 | $2,133 | $32,200 | $5,670 | $26,530 |
| 2015 | $1,936 | $32,200 | $5,670 | $26,530 |
| 2014 | $1,941 | $32,200 | $5,670 | $26,530 |
| 2013 | $957 | $32,200 | $5,670 | $26,530 |
Source: Public Records
Map
Nearby Homes
- 958 Bricker Blvd
- 1119 Stanhope Dr
- 515 Riverview Dr
- 1345 Fishinger Rd
- 1121 Afton Rd
- 1327 Friar Ln
- 3545 Shattuck Ave
- 3526 Rue de Fleur Unit B18U
- 751 Latham Ct
- 3027 Sunset Dr Unit 3027
- 187 W Pacemont Rd Unit 189
- 134 W Tulane Rd
- 126 W Tulane Rd
- 118 W Tulane Rd
- 109 W Pacemont Rd
- 94 W Tulane Rd
- 215 W Kenworth Rd
- 1763-1769 Ardleigh Rd Unit 1763-1769
- 2516 Chester Rd
- 1841 Inchcliff Rd