Estimated Value: $468,916 - $530,000
3
Beds
4
Baths
2,112
Sq Ft
$235/Sq Ft
Est. Value
About This Home
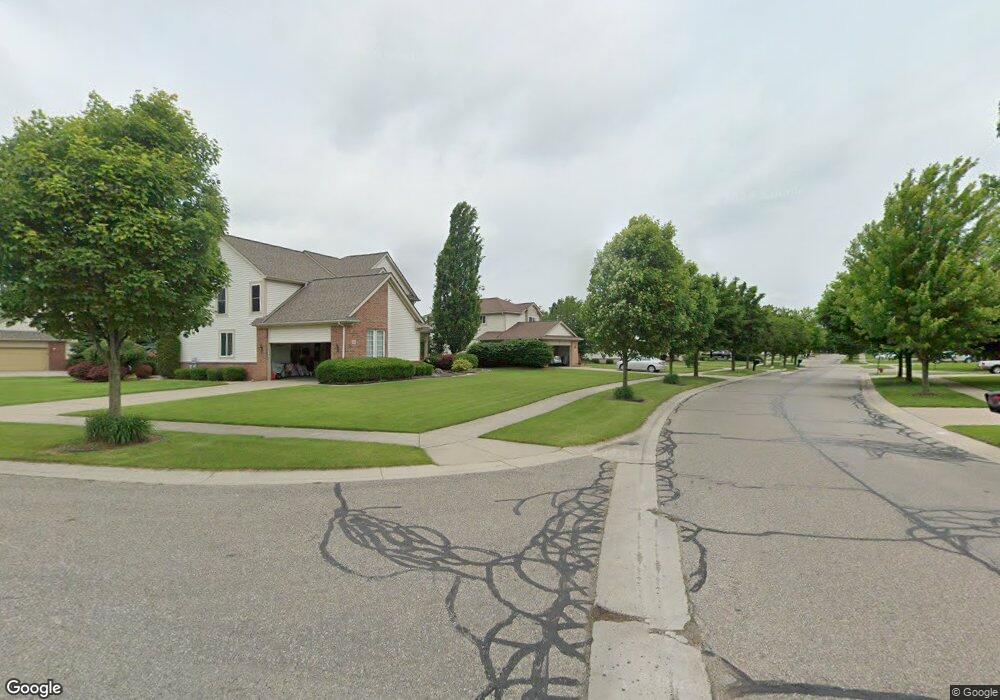
This home is located at 879 Pheasant Run West Dr, Wixom, MI 48393 and is currently estimated at $497,229, approximately $235 per square foot. 879 Pheasant Run West Dr is a home located in Oakland County with nearby schools including Walled Lake Elementary School, Sarah G. Banks Middle School, and Walled Lake Western High School.
Ownership History
Date
Name
Owned For
Owner Type
Purchase Details
Closed on
Nov 29, 2011
Sold by
Predd Amy and Mortgage Electronic Registrati
Bought by
Bank Of America Na
Current Estimated Value
Purchase Details
Closed on
Dec 7, 2004
Sold by
Keir David J and Keir Heidi L
Bought by
Predd Amy
Home Financials for this Owner
Home Financials are based on the most recent Mortgage that was taken out on this home.
Original Mortgage
$253,050
Interest Rate
5.82%
Mortgage Type
Purchase Money Mortgage
Purchase Details
Closed on
Dec 22, 2000
Sold by
Keir David J
Bought by
Keir David J
Home Financials for this Owner
Home Financials are based on the most recent Mortgage that was taken out on this home.
Original Mortgage
$233,700
Interest Rate
7.18%
Purchase Details
Closed on
Oct 29, 1999
Sold by
C C Buildingco Inc
Bought by
Keir David J
Create a Home Valuation Report for This Property
The Home Valuation Report is an in-depth analysis detailing your home's value as well as a comparison with similar homes in the area
Home Values in the Area
Average Home Value in this Area
Purchase History
| Date | Buyer | Sale Price | Title Company |
|---|---|---|---|
| Bank Of America Na | $252,320 | None Available | |
| Predd Amy | $319,000 | -- | |
| Keir David J | -- | -- | |
| Keir David J | $60,000 | -- |
Source: Public Records
Mortgage History
| Date | Status | Borrower | Loan Amount |
|---|---|---|---|
| Previous Owner | Predd Amy | $253,050 | |
| Previous Owner | Keir David J | $233,700 | |
| Closed | Predd Amy | $50,000 |
Source: Public Records
Tax History Compared to Growth
Tax History
| Year | Tax Paid | Tax Assessment Tax Assessment Total Assessment is a certain percentage of the fair market value that is determined by local assessors to be the total taxable value of land and additions on the property. | Land | Improvement |
|---|---|---|---|---|
| 2024 | $4,150 | $204,880 | $0 | $0 |
| 2023 | $3,933 | $176,470 | $0 | $0 |
| 2022 | $3,950 | $163,750 | $0 | $0 |
| 2021 | $3,920 | $162,160 | $0 | $0 |
| 2020 | $3,785 | $151,960 | $0 | $0 |
| 2019 | $3,936 | $146,980 | $0 | $0 |
| 2018 | $3,994 | $144,010 | $0 | $0 |
| 2017 | $3,943 | $142,440 | $0 | $0 |
| 2016 | $3,926 | $139,640 | $0 | $0 |
| 2015 | -- | $124,940 | $0 | $0 |
| 2014 | -- | $103,580 | $0 | $0 |
| 2011 | -- | $96,220 | $0 | $0 |
Source: Public Records
Map
Nearby Homes
- 3201 Roma Ct
- 3184 Roma Ct
- 3202 Roma Ct
- 3236 Curtis Rd
- 570 Maplewood
- 3584 W Maple Rd
- 2759 Maple Forest Dr Unit 84
- 3022 Theodore E
- 3010 Theodore
- 2988 Theodore
- 2750 Maple Forest Dr
- 2406 Madison St
- 2588 Maple Forest Ct
- 746 Red Maple Ln
- 340 N Wixom Rd
- 691 Chestnut Dr Unit 24
- 1369 Flamingo
- 3221 Chambers W
- 216 N Wixom Rd
- 3238 Johanna Ware W
- 879 Pheasant Run Dr W
- 893 Pheasant Run Dr W
- 893 Pheasant Run West Dr
- 865 Pheasant Run West Dr
- 907 Pheasant Run West Dr
- 3172 Thimbleberry Ct
- 3178 Thimbleberry Ct
- 3155 Mulberry Ct
- 3145 Roma Ct
- 864 Pheasant Run West Dr
- 864 Pheasant Run Dr W
- 925 Pheasant Run Dr W
- 925 Pheasant Run West Dr Unit Bldg-Unit
- 925 Pheasant Run West Dr
- 925 Pheasant Run
- 3149 Mulberry Ct
- 837 Pheasant Run West Dr
- 3158 Mulberry Ct
- 842 Pheasant Run West Dr
- 3169 Thimbleberry Ct