879 S Main St Attleboro, MA 02703
Estimated Value: $396,000 - $476,000
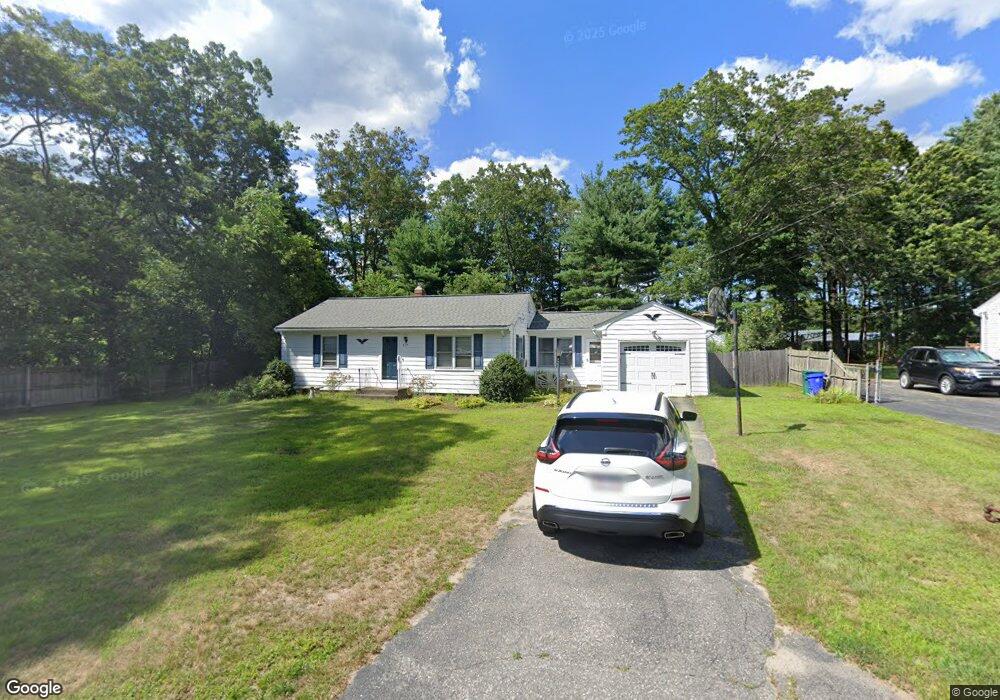
About This Home
This home is located at 879 S Main St, Attleboro, MA 02703 and is currently estimated at $437,376, approximately $499 per square foot. 879 S Main St is a home located in Bristol County with nearby schools including Peter Thacher Elementary School, Robert J. Coelho Middle School, and Attleboro High School.
Ownership History
We collect this data history from publicly available records. To have your information removed, we recommend requesting removal directly through your county’s website.
Purchase Details
Purchase Details
Home Values in the Area
Average Home Value in this Area
Purchase History
We collect this data history from publicly available records. To have your information removed, we recommend requesting removal directly through your county’s website.
| Date | Buyer | Sale Price | Title Company |
|---|---|---|---|
| -- | -- | ||
| $95,500 | -- |
Mortgage History
We collect this data history from publicly available records. To have your information removed, we recommend requesting removal directly through your county’s website.
| Date | Status | Borrower | Loan Amount |
|---|---|---|---|
| Previous Owner | $91,879 |
Tax History
We collect this data history from publicly available records. To have your information removed, we recommend requesting removal directly through your county’s website.
| Year | Tax Paid | Tax Assessment Tax Assessment Total Assessment is a certain percentage of the fair market value that is determined by local assessors to be the total taxable value of land and additions on the property. | Land | Improvement |
|---|---|---|---|---|
| 2025 | $4,008 | $319,400 | $145,200 | $174,200 |
| 2024 | $3,902 | $306,500 | $145,200 | $161,300 |
| 2023 | $3,707 | $270,800 | $132,000 | $138,800 |
| 2022 | $3,581 | $247,800 | $125,800 | $122,000 |
| 2021 | $3,339 | $225,600 | $121,000 | $104,600 |
| 2020 | $3,234 | $222,100 | $117,400 | $104,700 |
| 2019 | $3,088 | $218,100 | $115,200 | $102,900 |
| 2018 | $5,674 | $204,800 | $111,800 | $93,000 |
| 2017 | $2,843 | $195,400 | $111,800 | $83,600 |
| 2016 | $2,719 | $183,500 | $109,600 | $73,900 |
| 2015 | $2,717 | $184,700 | $109,600 | $75,100 |
| 2014 | $2,541 | $171,100 | $104,400 | $66,700 |
Map
- 1340 County St
- 10 Patrick St Unit 10
- 149 Thurber Ave
- 2 Burnside Ave
- 1234 Commerce Way
- 12 Valley Run Dr
- 2 Valley Run Dr
- 1531 County St
- 52 Carpenter St
- 206 Burnside Ave
- 323 Oakhill Ave
- 10 Dailey St Unit H
- 18 Dailey St Unit H
- 855 County St Unit 2
- 0 Joseph St Unit 73469304
- 0 Tulip Unit 73534486
- 0 Tulip Unit 73534508
- 0 Tulip Unit 73534483
- 0 Tulip Unit 73534502
- 144 Burnside Ave
Ask me questions while you tour the home.