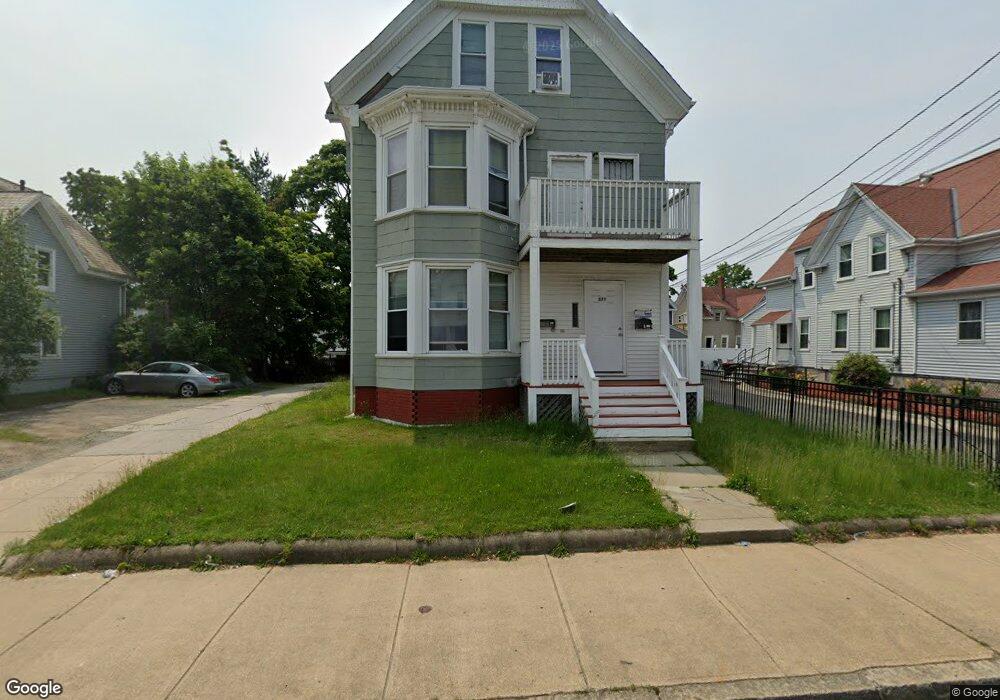
879 Warren Ave Brockton, MA 02301
Clifton Heights NeighborhoodEstimated Value: $664,964 - $925,000
7
Beds
3
Baths
3,932
Sq Ft
$213/Sq Ft
Est. Value
About This Home
This home is located at 879 Warren Ave, Brockton, MA 02301 and is currently estimated at $835,991, approximately $212 per square foot. 879 Warren Ave is a home located in Plymouth County with nearby schools including John F. Kennedy Elementary School, Davis K-8 School, and South Middle School.
Ownership History
Date
Name
Owned For
Owner Type
Purchase Details
Closed on
Jul 13, 2006
Sold by
Crowe Leo E and Randall Cheryl A
Bought by
Compere Hugo
Current Estimated Value
Home Financials for this Owner
Home Financials are based on the most recent Mortgage that was taken out on this home.
Original Mortgage
$281,600
Outstanding Balance
$165,965
Interest Rate
6.71%
Mortgage Type
Purchase Money Mortgage
Estimated Equity
$670,026
Create a Home Valuation Report for This Property
The Home Valuation Report is an in-depth analysis detailing your home's value as well as a comparison with similar homes in the area
Home Values in the Area
Average Home Value in this Area
Purchase History
| Date | Buyer | Sale Price | Title Company |
|---|---|---|---|
| Compere Hugo | $352,000 | -- | |
| Compere Hugo | $352,000 | -- |
Source: Public Records
Mortgage History
| Date | Status | Borrower | Loan Amount |
|---|---|---|---|
| Open | Compere Hugo | $35,000 | |
| Open | Compere Hugo | $281,600 | |
| Closed | Compere Hugo | $70,400 | |
| Closed | Compere Hugo | $281,600 |
Source: Public Records
Tax History Compared to Growth
Tax History
| Year | Tax Paid | Tax Assessment Tax Assessment Total Assessment is a certain percentage of the fair market value that is determined by local assessors to be the total taxable value of land and additions on the property. | Land | Improvement |
|---|---|---|---|---|
| 2025 | $8,364 | $690,700 | $140,300 | $550,400 |
| 2024 | $8,287 | $689,400 | $140,300 | $549,100 |
| 2023 | $8,141 | $627,200 | $105,200 | $522,000 |
| 2022 | $8,202 | $587,100 | $95,700 | $491,400 |
| 2021 | $7,431 | $512,500 | $79,700 | $432,800 |
| 2020 | $9,006 | $455,600 | $74,400 | $381,200 |
| 2019 | $6,314 | $406,300 | $72,500 | $333,800 |
| 2018 | $5,859 | $364,800 | $72,500 | $292,300 |
| 2017 | $8,582 | $348,300 | $72,500 | $275,800 |
| 2016 | $5,010 | $288,600 | $70,400 | $218,200 |
| 2015 | $4,109 | $226,400 | $70,400 | $156,000 |
| 2014 | $3,952 | $218,000 | $70,400 | $147,600 |
Source: Public Records
Map
Nearby Homes