Estimated Value: $449,000 - $553,000
3
Beds
2
Baths
1,862
Sq Ft
$260/Sq Ft
Est. Value
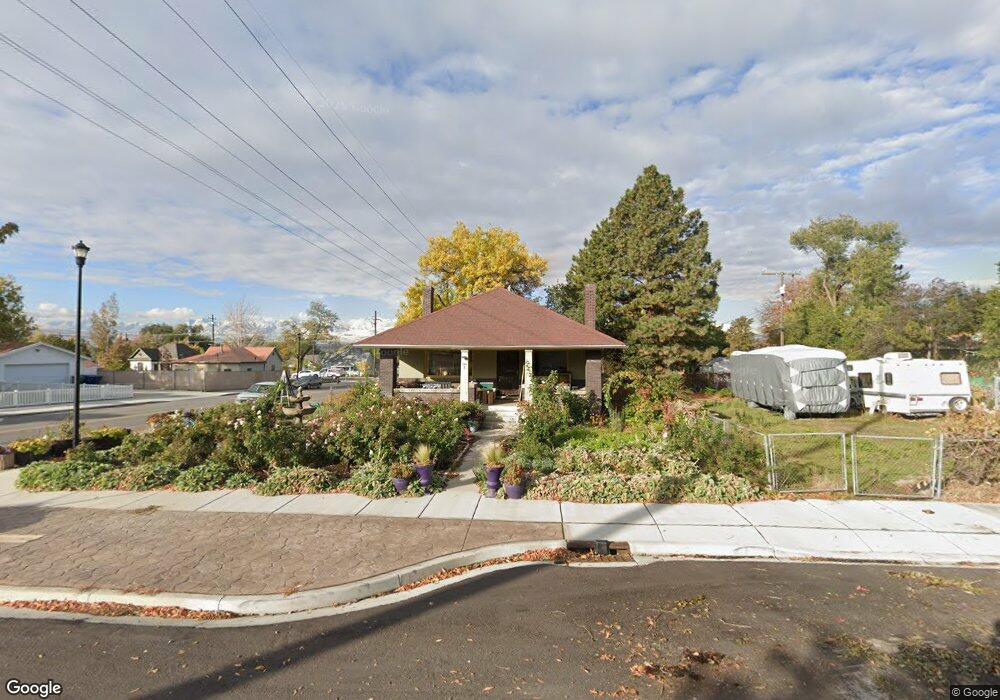
About This Home
This home is located at 8790 S 120 E, Sandy, UT 84070 and is currently estimated at $483,745, approximately $259 per square foot. 8790 S 120 E is a home located in Salt Lake County with nearby schools including Sandy Elementary School, Mount Jordan Middle School, and Jordan High.
Ownership History
Date
Name
Owned For
Owner Type
Purchase Details
Closed on
Jul 30, 2019
Sold by
Hurst Mark E and Mark Eugene Hurst Trust
Bought by
Taylor Mark Mason
Current Estimated Value
Home Financials for this Owner
Home Financials are based on the most recent Mortgage that was taken out on this home.
Original Mortgage
$303,000
Outstanding Balance
$265,915
Interest Rate
3.8%
Mortgage Type
New Conventional
Estimated Equity
$217,830
Purchase Details
Closed on
Nov 2, 2010
Sold by
Hurst Mark E
Bought by
Hurst Mark E
Create a Home Valuation Report for This Property
The Home Valuation Report is an in-depth analysis detailing your home's value as well as a comparison with similar homes in the area
Home Values in the Area
Average Home Value in this Area
Purchase History
| Date | Buyer | Sale Price | Title Company |
|---|---|---|---|
| Taylor Mark Mason | -- | Stewart Title Ins Agcy Of Ut | |
| Hurst Mark E | -- | None Available |
Source: Public Records
Mortgage History
| Date | Status | Borrower | Loan Amount |
|---|---|---|---|
| Open | Taylor Mark Mason | $303,000 |
Source: Public Records
Tax History
| Year | Tax Paid | Tax Assessment Tax Assessment Total Assessment is a certain percentage of the fair market value that is determined by local assessors to be the total taxable value of land and additions on the property. | Land | Improvement |
|---|---|---|---|---|
| 2025 | $2,373 | $486,700 | $122,000 | $364,700 |
| 2024 | $2,373 | $438,900 | $111,900 | $327,000 |
| 2023 | $2,139 | $394,400 | $106,400 | $288,000 |
| 2022 | $2,258 | $406,800 | $104,300 | $302,500 |
| 2021 | $2,146 | $329,000 | $81,600 | $247,400 |
| 2020 | $2,028 | $293,200 | $81,600 | $211,600 |
| 2019 | $1,811 | $255,200 | $77,500 | $177,700 |
| 2016 | $1,478 | $200,200 | $55,800 | $144,400 |
Source: Public Records
Map
Nearby Homes
- 8558 S Center St
- 112 E 8680 S
- 270 E 8680 S
- 220 E Pioneer Ave
- 194 Pioneer Ave
- 149 E Pioneer Ave
- 87 Pioneer Ave
- 87 W 8710 S
- 8470 Solar Way
- 412 E 8760 S
- 227 E St Germain Way
- 140 W 8710 S
- 140 Paula Dr
- 136 W Freedom Ave Unit 136
- 8459 S 300 E
- 181 E 9180 S
- 8812 S Stratford Cir
- 36 E Opequon Rd
- 132 E Chambord Ct
- 362 E 9150 S
Your Personal Tour Guide
Ask me questions while you tour the home.