Estimated Value: $615,000 - $693,816
4
Beds
2
Baths
2,028
Sq Ft
$319/Sq Ft
Est. Value
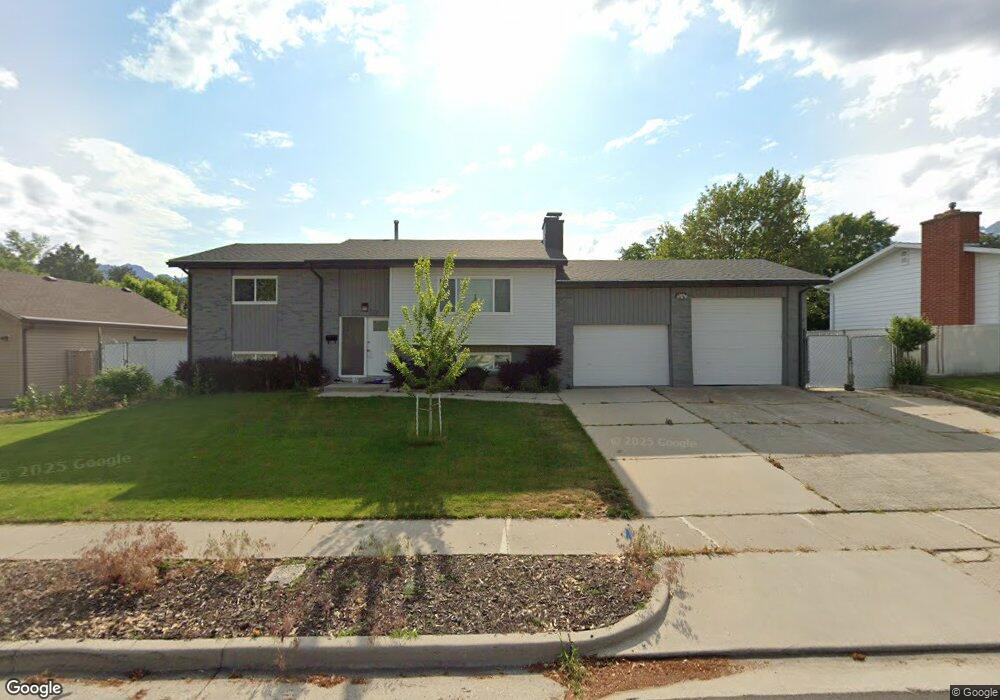
About This Home
This home is located at 8793 S 1540 E, Sandy, UT 84093 and is currently estimated at $647,704, approximately $319 per square foot. 8793 S 1540 E is a home located in Salt Lake County with nearby schools including Silver Mesa Elementary School, Union Middle School, and Hillcrest High School.
Ownership History
Date
Name
Owned For
Owner Type
Purchase Details
Closed on
Jun 30, 2023
Sold by
Jnc Enterprises Inc
Bought by
Jerrys Yard Sale Llc
Current Estimated Value
Purchase Details
Closed on
Feb 3, 2023
Sold by
Beate Shaw Family Trust
Bought by
Jnc Enterprises Inc
Home Financials for this Owner
Home Financials are based on the most recent Mortgage that was taken out on this home.
Original Mortgage
$378,000
Interest Rate
6.27%
Mortgage Type
New Conventional
Purchase Details
Closed on
Feb 2, 2023
Sold by
Beate Shaw Family Trust and Shaw Beate H
Bought by
Jnc Enterprises Inc
Home Financials for this Owner
Home Financials are based on the most recent Mortgage that was taken out on this home.
Original Mortgage
$378,000
Interest Rate
6.27%
Mortgage Type
New Conventional
Purchase Details
Closed on
Apr 28, 2022
Sold by
Beate Shaw Family Trust
Bought by
Beate Shaw Family Trust
Purchase Details
Closed on
Jul 16, 2021
Sold by
Shaw Beate H
Bought by
Shaw Beate H and Beate Shaw Family Trust
Purchase Details
Closed on
Apr 8, 2011
Sold by
Shaw Beate H
Bought by
Shaw Beate H
Purchase Details
Closed on
Jul 15, 1998
Sold by
First Security Bank National Assn
Bought by
Hahn Werner E A and Hahn Eva K
Create a Home Valuation Report for This Property
The Home Valuation Report is an in-depth analysis detailing your home's value as well as a comparison with similar homes in the area
Home Values in the Area
Average Home Value in this Area
Purchase History
| Date | Buyer | Sale Price | Title Company |
|---|---|---|---|
| Jerrys Yard Sale Llc | -- | Monument Title | |
| Jnc Enterprises Inc | -- | Stewart Title Insurance Agency | |
| Jnc Enterprises Inc | -- | Stewart Title Insurance Agency | |
| Beate Shaw Family Trust | -- | None Listed On Document | |
| Shaw Beate H | -- | None Available | |
| Shaw Beate H | -- | None Available | |
| Hahn Werner E A | -- | -- |
Source: Public Records
Mortgage History
| Date | Status | Borrower | Loan Amount |
|---|---|---|---|
| Previous Owner | Jnc Enterprises Inc | $378,000 | |
| Previous Owner | Jnc Enterprises Inc | $378,000 |
Source: Public Records
Tax History
| Year | Tax Paid | Tax Assessment Tax Assessment Total Assessment is a certain percentage of the fair market value that is determined by local assessors to be the total taxable value of land and additions on the property. | Land | Improvement |
|---|---|---|---|---|
| 2025 | $4,518 | $686,600 | $173,200 | $513,400 |
| 2024 | $4,518 | $646,400 | $161,800 | $484,600 |
| 2023 | $4,518 | $459,600 | $153,800 | $305,800 |
| 2022 | $3,149 | $466,500 | $150,800 | $315,700 |
| 2021 | $2,707 | $351,700 | $122,400 | $229,300 |
| 2020 | $2,489 | $302,700 | $122,400 | $180,300 |
| 2019 | $2,348 | $283,800 | $115,400 | $168,400 |
| 2018 | $2,241 | $274,300 | $115,400 | $158,900 |
| 2017 | $2,110 | $253,400 | $115,400 | $138,000 |
| 2016 | $2,093 | $247,500 | $115,400 | $132,100 |
| 2015 | $2,161 | $237,900 | $142,900 | $95,000 |
| 2014 | $2,055 | $220,300 | $133,900 | $86,400 |
Source: Public Records
Map
Nearby Homes
- 1579 E 8730 S
- 8797 S Capella Way
- 8857 S Capella Way
- 1430 E 8685 S
- 1371 Sudbury Ave
- 8638 Piper Ln
- 8642 S Cessna Cir
- 1482 Waters Ln
- 8492 S Mesa Dr
- 1891 Richard Rd
- 8411 S 1475 E
- 1627 E Mulberry Way
- 8352 S 1330 E
- 8935 Quarry Stone Way
- 8569 Round Stone Cove
- 8569 Round Stone Cove Unit 8
- 1924 E Viscounti Cove
- 8492 Fayeway Dr
- 1138 E Quarry Stone Way
- 8971 Valley Bend Ct
Your Personal Tour Guide
Ask me questions while you tour the home.