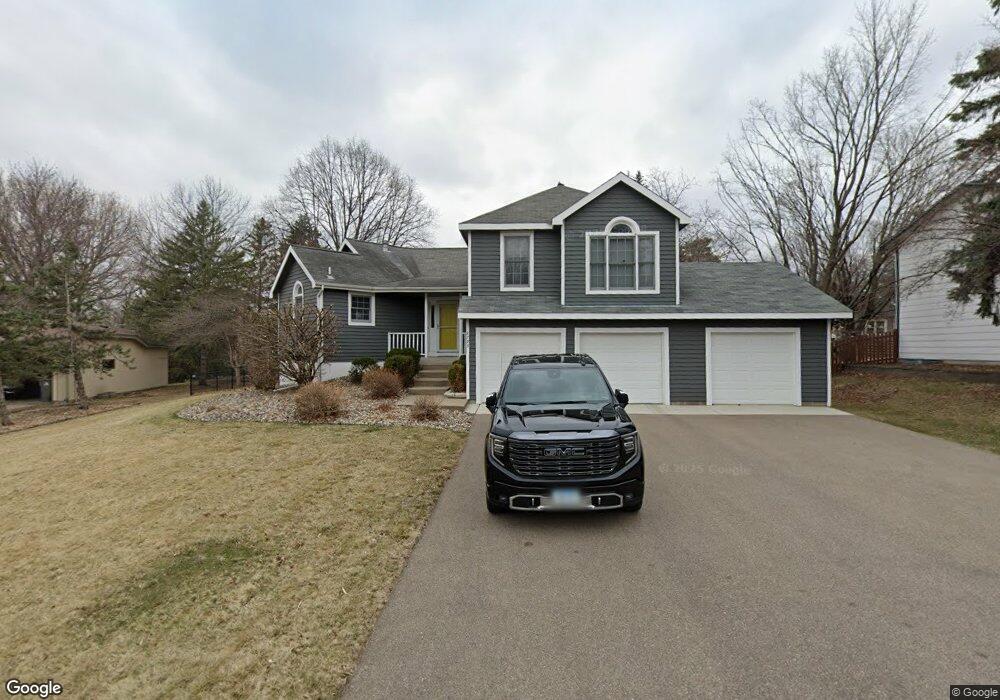
8793 Sycamore Ct Eden Prairie, MN 55347
Estimated Value: $463,000 - $516,000
3
Beds
3
Baths
2,081
Sq Ft
$240/Sq Ft
Est. Value
About This Home
This home is located at 8793 Sycamore Ct, Eden Prairie, MN 55347 and is currently estimated at $499,565, approximately $240 per square foot. 8793 Sycamore Ct is a home located in Hennepin County with nearby schools including Central Middle School, Eden Prairie High School, and Primrose School of Eden Prairie.
Ownership History
Date
Name
Owned For
Owner Type
Purchase Details
Closed on
Mar 14, 2024
Sold by
Leland Anne Elizabeth
Bought by
Clark Matthew James
Current Estimated Value
Purchase Details
Closed on
Nov 19, 2015
Sold by
Krahn Aaron K and Krahn Jill R
Bought by
Leland Clark Matthew J and Leland Clark Anne E
Home Financials for this Owner
Home Financials are based on the most recent Mortgage that was taken out on this home.
Original Mortgage
$301,410
Interest Rate
3.74%
Mortgage Type
New Conventional
Purchase Details
Closed on
Jul 31, 2009
Sold by
Jenson Eric D and Saathoff Mary T
Bought by
Krahn Aaron
Purchase Details
Closed on
May 30, 2003
Sold by
Steffen Glenn J and Steffen Amy M
Bought by
Jensen Erick D and Seathoff Mary T
Purchase Details
Closed on
Oct 26, 1995
Sold by
Porritt Jeffrey
Bought by
Steffan Glenn J and Steffan Amy M
Create a Home Valuation Report for This Property
The Home Valuation Report is an in-depth analysis detailing your home's value as well as a comparison with similar homes in the area
Home Values in the Area
Average Home Value in this Area
Purchase History
| Date | Buyer | Sale Price | Title Company |
|---|---|---|---|
| Clark Matthew James | -- | None Listed On Document | |
| Leland Clark Matthew J | $334,900 | Title One Inc | |
| Krahn Aaron | $317,500 | -- | |
| Jensen Erick D | $267,000 | -- | |
| Steffan Glenn J | $167,500 | -- |
Source: Public Records
Mortgage History
| Date | Status | Borrower | Loan Amount |
|---|---|---|---|
| Previous Owner | Leland Clark Matthew J | $301,410 |
Source: Public Records
Tax History Compared to Growth
Tax History
| Year | Tax Paid | Tax Assessment Tax Assessment Total Assessment is a certain percentage of the fair market value that is determined by local assessors to be the total taxable value of land and additions on the property. | Land | Improvement |
|---|---|---|---|---|
| 2024 | $5,595 | $471,400 | $164,500 | $306,900 |
| 2023 | $5,275 | $466,900 | $162,900 | $304,000 |
| 2022 | $4,594 | $462,600 | $161,400 | $301,200 |
| 2021 | $4,122 | $376,000 | $131,200 | $244,800 |
| 2020 | $4,219 | $342,600 | $154,300 | $188,300 |
| 2019 | $4,157 | $339,400 | $152,800 | $186,600 |
| 2018 | $4,020 | $330,900 | $149,900 | $181,000 |
| 2017 | $3,948 | $305,300 | $140,000 | $165,300 |
| 2016 | $3,925 | $301,400 | $130,500 | $170,900 |
| 2015 | $3,873 | $287,100 | $124,300 | $162,800 |
| 2014 | -- | $256,400 | $111,000 | $145,400 |
Source: Public Records
Map
Nearby Homes
- 14364 Westridge Dr
- 8956 Garland Ct
- 8868 Knollwood Dr
- 14258 Towers Ln
- 8991 Ferndale Ln
- 14216 Towers Ln
- 8945 Hilloway Rd
- 14773 Langdon Place
- 14396 Sorrel Way
- 13543 Carmody Dr
- 8439 Cortland Rd Unit 136
- 9030 W Staring Ln
- 8419 Cortland Rd
- 9026 Terra Verde Trail
- 15091 Amur Hill Ln
- 8990 Scarlet Globe Dr
- 13207 Bush Ln
- 9030x W Staring Ln
- 9100 Terra Verde Trail Unit 152
- 13171 Murdock Terrace
- 8797 Sycamore Ct
- 8789 Sycamore Ct
- 14116 Westridge Dr
- 8794 Sycamore Ct
- 14118 Westridge Dr
- 8790 Sycamore Ct
- 8801 Sycamore Ct
- 14115 Westridge Dr
- 8787 Sycamore Ct
- 8798 Sycamore Ct
- 8806 Sycamore Ct
- 14122 Westridge Dr
- 14413 Westridge Dr
- 14119 Westridge Dr
- 8802 Sycamore Ct
- 8788 Sycamore Ct
- 14117 Westridge Dr
- 14407 Westridge Dr
- 8785 Sycamore Ct
- 8868 Flesher Cir