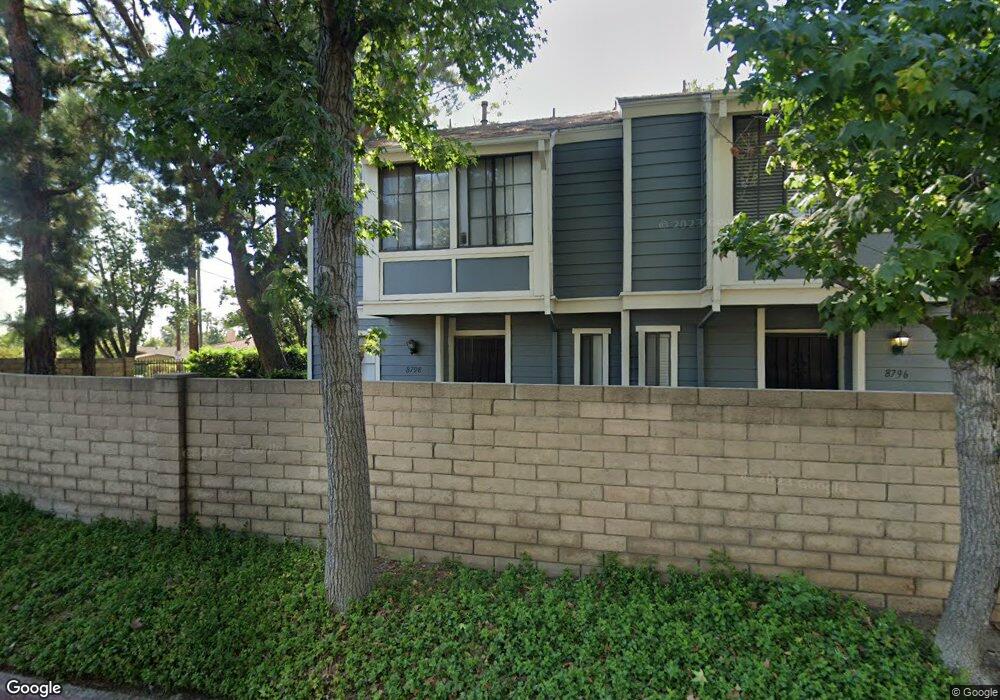
8798 Pine Crest Place Rancho Cucamonga, CA 91730
Estimated Value: $429,000 - $476,000
2
Beds
2
Baths
1,179
Sq Ft
$375/Sq Ft
Est. Value
About This Home
This home is located at 8798 Pine Crest Place, Rancho Cucamonga, CA 91730 and is currently estimated at $441,675, approximately $374 per square foot. 8798 Pine Crest Place is a home located in San Bernardino County with nearby schools including Cucamonga Elementary, Rancho Cucamonga Middle, and Chaffey High School.
Ownership History
Date
Name
Owned For
Owner Type
Purchase Details
Closed on
Jan 15, 2026
Sold by
Paredes Luis
Bought by
Luis Manuel Paredes Living Trust and Paredes
Current Estimated Value
Purchase Details
Closed on
Jul 24, 2018
Sold by
Paredes Irene
Bought by
Paredes Luis
Home Financials for this Owner
Home Financials are based on the most recent Mortgage that was taken out on this home.
Original Mortgage
$102,195
Interest Rate
4.6%
Mortgage Type
New Conventional
Purchase Details
Closed on
Sep 27, 2010
Sold by
Perez David J
Bought by
Paredes Luis and Paredes Irene
Home Financials for this Owner
Home Financials are based on the most recent Mortgage that was taken out on this home.
Original Mortgage
$88,000
Interest Rate
4.43%
Mortgage Type
New Conventional
Purchase Details
Closed on
Sep 25, 2006
Sold by
Sparks Jocelyn E
Bought by
Perez David J
Home Financials for this Owner
Home Financials are based on the most recent Mortgage that was taken out on this home.
Original Mortgage
$240,000
Interest Rate
6%
Mortgage Type
Purchase Money Mortgage
Purchase Details
Closed on
Apr 4, 2003
Sold by
Gamarra Lupe
Bought by
Sparks Jocelyn E
Home Financials for this Owner
Home Financials are based on the most recent Mortgage that was taken out on this home.
Original Mortgage
$124,400
Interest Rate
5.84%
Purchase Details
Closed on
May 2, 2002
Sold by
Wissa Maged F
Bought by
Gamarra Lupe
Home Financials for this Owner
Home Financials are based on the most recent Mortgage that was taken out on this home.
Original Mortgage
$129,960
Interest Rate
7.13%
Mortgage Type
FHA
Purchase Details
Closed on
Apr 16, 1999
Sold by
Cai Qijun
Bought by
Wissa Maged F and Masoud Dina
Home Financials for this Owner
Home Financials are based on the most recent Mortgage that was taken out on this home.
Original Mortgage
$83,871
Interest Rate
6.92%
Mortgage Type
FHA
Purchase Details
Closed on
Nov 2, 1994
Sold by
Hud
Bought by
Cai Qijun
Home Financials for this Owner
Home Financials are based on the most recent Mortgage that was taken out on this home.
Original Mortgage
$57,900
Interest Rate
9.08%
Mortgage Type
FHA
Purchase Details
Closed on
Apr 25, 1994
Sold by
Countrywide Title Corp
Bought by
Countrywide Funding Corp
Purchase Details
Closed on
Apr 20, 1994
Sold by
Countrywide Funding Corp
Bought by
Hud
Create a Home Valuation Report for This Property
The Home Valuation Report is an in-depth analysis detailing your home's value as well as a comparison with similar homes in the area
Purchase History
| Date | Buyer | Sale Price | Title Company |
|---|---|---|---|
| Luis Manuel Paredes Living Trust | -- | None Listed On Document | |
| Paredes Luis | -- | Title Connect Inc | |
| Paredes Luis | $110,000 | Lawyers Title Company | |
| Perez David J | $300,000 | North American Title Company | |
| Sparks Jocelyn E | $155,500 | First American | |
| Gamarra Lupe | $132,000 | First American | |
| Wissa Maged F | $84,000 | First American Title Ins Co | |
| Cai Qijun | $59,000 | Fidelity National Title Ins | |
| Countrywide Funding Corp | $102,051 | Stewart Title Co | |
| Hud | -- | World Title Company |
Source: Public Records
Mortgage History
| Date | Status | Borrower | Loan Amount |
|---|---|---|---|
| Previous Owner | Paredes Luis | $102,195 | |
| Previous Owner | Paredes Luis | $88,000 | |
| Previous Owner | Perez David J | $240,000 | |
| Previous Owner | Sparks Jocelyn E | $124,400 | |
| Previous Owner | Gamarra Lupe | $129,960 | |
| Previous Owner | Wissa Maged F | $83,871 | |
| Previous Owner | Cai Qijun | $57,900 | |
| Closed | Sparks Jocelyn E | $31,100 |
Source: Public Records
Tax History
| Year | Tax Paid | Tax Assessment Tax Assessment Total Assessment is a certain percentage of the fair market value that is determined by local assessors to be the total taxable value of land and additions on the property. | Land | Improvement |
|---|---|---|---|---|
| 2025 | $1,602 | $140,929 | $49,324 | $91,605 |
| 2024 | $1,562 | $138,166 | $48,357 | $89,809 |
| 2023 | $2,948 | $135,457 | $47,409 | $88,048 |
| 2022 | $2,922 | $132,801 | $46,479 | $86,322 |
| 2021 | $2,910 | $130,197 | $45,568 | $84,629 |
| 2020 | $2,875 | $128,862 | $45,101 | $83,761 |
| 2019 | $2,858 | $126,336 | $44,217 | $82,119 |
| 2018 | $1,423 | $123,859 | $43,350 | $80,509 |
| 2017 | $1,375 | $121,430 | $42,500 | $78,930 |
| 2016 | $1,358 | $119,049 | $41,667 | $77,382 |
| 2015 | $1,349 | $117,261 | $41,041 | $76,220 |
| 2014 | $1,311 | $114,964 | $40,237 | $74,727 |
Source: Public Records
Map
Nearby Homes
- 8703 Pine Crest Place
- 10108 24th St
- 10116 Bedford Dr
- 10215 25th St
- 10235 Anacapa Ct
- 10239 24th St
- 10151 Arrow Route Unit 59
- 10151 Arrow Route Unit 6
- 9805 Devon St
- 8423 Western Trail Place Unit H
- 10209 26th St
- 8232 Malven Ave
- 8425 Sunset Trail Place Unit F
- 9522 Harvest Vista Dr
- 8214 Jadeite Ave
- 8214 Klusman Ave
- 10330 Jaybird Rd
- 9999 Foothill Blvd Unit 48
- 9999 Foothill Blvd Unit 111
- 9999 Foothill Blvd Unit 132
- 8796 Pine Crest Place
- 8794 Pine Crest Place
- 8788 1/2 Pine Crest Place
- 8792 Pine Crest Place
- 8788 Pine Crest Place
- 8790 Pine Crest Place
- 8786 1/2 Pine Crest Place
- 8786 Pine Crest Place
- 8793 Pine Crest Place
- 8791 Pine Crest Place
- 8784 Pine Crest Place
- 8789 Pine Crest Place
- 8787 Pine Crest Place
- 8785 Pine Crest Place
- 8772 1/2 Pine Crest Place
- 8772 Pine Crest Place
- 8782 E Pine Crest-1 2 Place
- 8782 Pine Crest Place
- 8783 Pine Crest Place
- 8770 1/2 Pine Crest Place
Your Personal Tour Guide
Ask me questions while you tour the home.