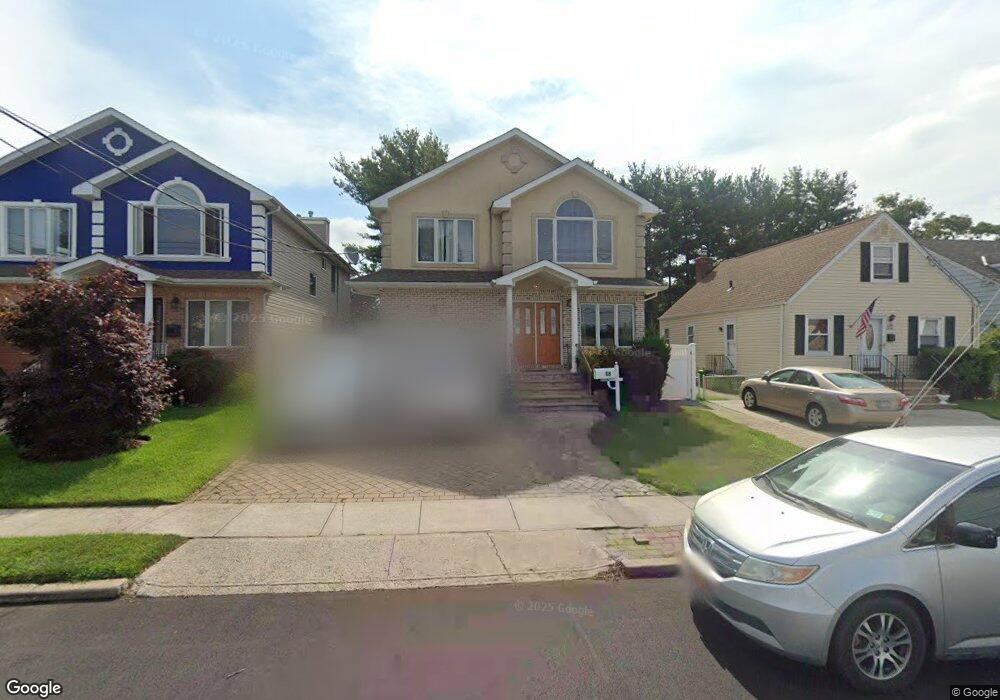
88 Barrymore Blvd Franklin Square, NY 11010
Estimated Value: $984,166 - $985,000
4
Beds
3
Baths
2,454
Sq Ft
$401/Sq Ft
Est. Value
About This Home
This home is located at 88 Barrymore Blvd, Franklin Square, NY 11010 and is currently estimated at $984,583, approximately $401 per square foot. 88 Barrymore Blvd is a home located in Nassau County with nearby schools including St Anne's School.
Ownership History
Date
Name
Owned For
Owner Type
Purchase Details
Closed on
May 29, 2019
Sold by
Sacarello Ricardo
Bought by
Yang Sai Zhen
Current Estimated Value
Home Financials for this Owner
Home Financials are based on the most recent Mortgage that was taken out on this home.
Original Mortgage
$470,000
Outstanding Balance
$411,524
Interest Rate
4.1%
Mortgage Type
Adjustable Rate Mortgage/ARM
Estimated Equity
$573,059
Purchase Details
Closed on
Nov 13, 2013
Sold by
Amato Roxanne
Bought by
Sacarello Ricardo and Sacarello Tiffany
Home Financials for this Owner
Home Financials are based on the most recent Mortgage that was taken out on this home.
Original Mortgage
$472,000
Interest Rate
4.29%
Mortgage Type
VA
Purchase Details
Closed on
Mar 15, 2007
Sold by
Cap-Land Homes Inc
Bought by
Amato Alfred
Purchase Details
Closed on
Apr 21, 2006
Sold by
Cap-Land Homes Inc
Purchase Details
Closed on
Feb 9, 2004
Sold by
Bolton Simonne
Bought by
Cap-Land Homes Inc
Create a Home Valuation Report for This Property
The Home Valuation Report is an in-depth analysis detailing your home's value as well as a comparison with similar homes in the area
Home Values in the Area
Average Home Value in this Area
Purchase History
| Date | Buyer | Sale Price | Title Company |
|---|---|---|---|
| Yang Sai Zhen | $708,888 | None Available | |
| Sacarello Ricardo | $660,000 | -- | |
| Amato Alfred | $670,000 | -- | |
| -- | -- | -- | |
| Cap-Land Homes Inc | $350,000 | -- |
Source: Public Records
Mortgage History
| Date | Status | Borrower | Loan Amount |
|---|---|---|---|
| Open | Yang Sai Zhen | $470,000 | |
| Previous Owner | Sacarello Ricardo | $472,000 |
Source: Public Records
Tax History Compared to Growth
Tax History
| Year | Tax Paid | Tax Assessment Tax Assessment Total Assessment is a certain percentage of the fair market value that is determined by local assessors to be the total taxable value of land and additions on the property. | Land | Improvement |
|---|---|---|---|---|
| 2025 | $16,348 | $631 | $219 | $412 |
| 2024 | $5,257 | $639 | $222 | $417 |
| 2023 | $16,982 | $729 | $258 | $471 |
| 2022 | $16,982 | $743 | $258 | $485 |
| 2021 | $22,534 | $710 | $220 | $490 |
| 2020 | $29,935 | $1,097 | $532 | $565 |
| 2019 | $4,780 | $1,336 | $648 | $688 |
| 2018 | $0 | $1,336 | $0 | $0 |
| 2017 | $0 | $1,336 | $648 | $688 |
| 2016 | $4,286 | $1,336 | $648 | $688 |
| 2015 | $3,884 | $1,336 | $648 | $688 |
| 2014 | $3,884 | $1,336 | $648 | $688 |
| 2013 | $5,749 | $1,336 | $648 | $688 |
Source: Public Records
Map
Nearby Homes
- 120 Barrymore Blvd
- 178 Farnum Blvd
- 62 Herman Blvd
- 163 Herman Blvd
- 44 Catherine Ave
- 261 Fernwood Terrace
- 51 Pacific St
- 182 Lexington Ave
- 700 Tulip Ave
- 1098 Russell St
- 9 Court St
- 31 Evans Ave
- 217 Elton Rd
- 1319 Journal Ave
- 162 Crown Ave
- 1045 Cathedral Ave
- 1134 Rosegold St
- 1041 Russell St
- 78 New Hyde Park Rd
- 89 Hunnewell Ave
- 90 Barrymore Blvd
- 84 Barrymore Blvd
- 76 Barrymore Blvd
- 92 Barrymore Blvd
- 74 Barrymore Blvd
- 100 Barrymore Blvd
- 85 Barrymore Blvd
- 95 Barrymore Blvd
- 1183 Whiteside Ave
- 101 Barrymore Blvd
- 104 Barrymore Blvd
- 68 Barrymore Blvd
- 73 Barrymore Blvd
- 105 Barrymore Blvd
- 108 Barrymore Blvd
- 1202 Whiteside Ave
- 94 Farnum Blvd
- 111 Barrymore Blvd
- 62 Barrymore Blvd
- 63 Barrymore Blvd