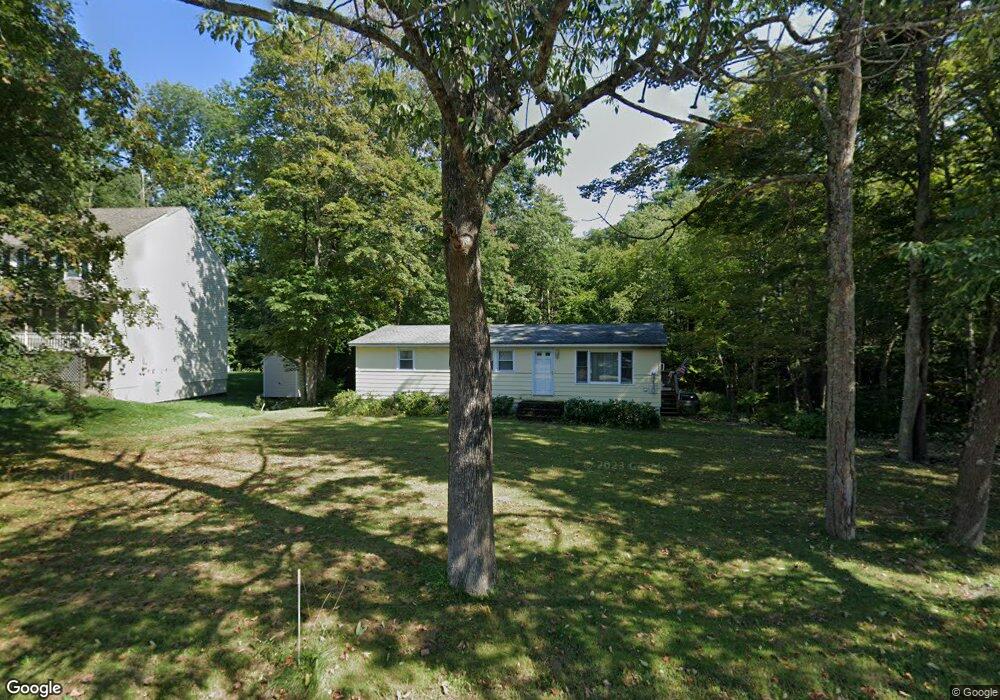
88 Cedar St Sturbridge, MA 01566
Estimated Value: $357,121 - $430,000
2
Beds
2
Baths
1,098
Sq Ft
$348/Sq Ft
Est. Value
About This Home
This home is located at 88 Cedar St, Sturbridge, MA 01566 and is currently estimated at $382,530, approximately $348 per square foot. 88 Cedar St is a home located in Worcester County with nearby schools including Burgess Elementary School, Tantasqua Regional Junior High School, and Tantasqua Regional High School.
Ownership History
Date
Name
Owned For
Owner Type
Purchase Details
Closed on
Aug 13, 2004
Sold by
Cournoyer Patricia C and Cournoyer Philip J
Bought by
Zeleznok Regina M and Zeleznok Richard J
Current Estimated Value
Home Financials for this Owner
Home Financials are based on the most recent Mortgage that was taken out on this home.
Original Mortgage
$169,900
Outstanding Balance
$83,943
Interest Rate
6.16%
Mortgage Type
Purchase Money Mortgage
Estimated Equity
$298,587
Create a Home Valuation Report for This Property
The Home Valuation Report is an in-depth analysis detailing your home's value as well as a comparison with similar homes in the area
Home Values in the Area
Average Home Value in this Area
Purchase History
| Date | Buyer | Sale Price | Title Company |
|---|---|---|---|
| Zeleznok Regina M | $189,900 | -- |
Source: Public Records
Mortgage History
| Date | Status | Borrower | Loan Amount |
|---|---|---|---|
| Open | Zeleznok Regina M | $169,900 |
Source: Public Records
Tax History
| Year | Tax Paid | Tax Assessment Tax Assessment Total Assessment is a certain percentage of the fair market value that is determined by local assessors to be the total taxable value of land and additions on the property. | Land | Improvement |
|---|---|---|---|---|
| 2025 | $4,242 | $266,300 | $72,600 | $193,700 |
| 2024 | $4,002 | $242,700 | $71,100 | $171,600 |
| 2023 | $3,789 | $209,700 | $62,300 | $147,400 |
| 2022 | $3,640 | $190,100 | $56,200 | $133,900 |
| 2021 | $3,311 | $174,100 | $53,600 | $120,500 |
| 2020 | $3,311 | $174,100 | $53,600 | $120,500 |
| 2019 | $3,196 | $166,900 | $55,400 | $111,500 |
| 2018 | $3,073 | $158,100 | $52,700 | $105,400 |
| 2017 | $2,933 | $151,200 | $50,800 | $100,400 |
| 2016 | $2,995 | $155,900 | $49,200 | $106,700 |
| 2015 | $2,938 | $152,700 | $49,200 | $103,500 |
Source: Public Records
Map
Nearby Homes
- 26 Cedar Lake Dr
- 7 Crescent Way Unit 105
- 7 Crescent Way Unit 315
- 43 Mountain Brook Rd
- 46 Westwood Dr
- 19 Arnold Rd
- 368 Main St
- 5 Hinman St Unit 4
- 73 New Boston Rd
- 504 Main St
- 365 Main St Unit 3
- 19 Preserve Way
- 537 Main St
- 9 Haynes St
- 87 Holland Rd
- 1 Chase Rd
- Lot B-6 River Rd
- 0 Fiske Hill Rd
- 8 Blueberry Ln
- 69 Farquhar Rd
Your Personal Tour Guide
Ask me questions while you tour the home.