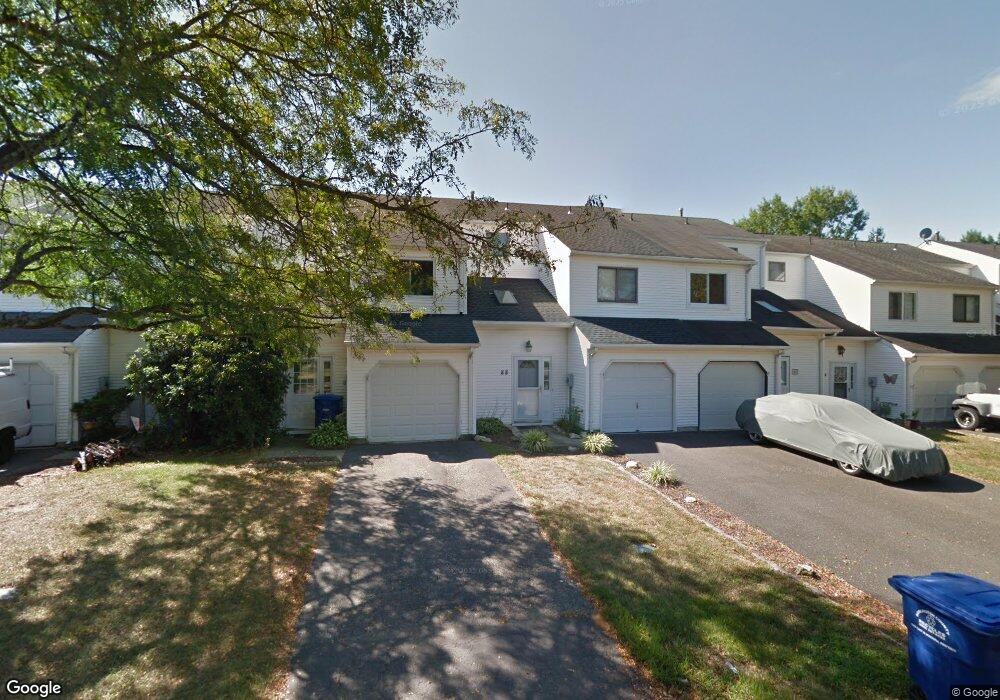
88 Ginger Dr Lumberton, NJ 08048
Estimated Value: $321,000 - $338,000
Studio
--
Bath
1,540
Sq Ft
$214/Sq Ft
Est. Value
About This Home
This home is located at 88 Ginger Dr, Lumberton, NJ 08048 and is currently estimated at $330,074, approximately $214 per square foot. 88 Ginger Dr is a home located in Burlington County with nearby schools including Ashbrook Elementary School, Bobby’s Run School, and Lumberton Middle School.
Ownership History
Date
Name
Owned For
Owner Type
Purchase Details
Closed on
Jun 27, 2002
Sold by
Walker Sally Ann and Walker Elizabeth E
Bought by
Libby Kevin P
Current Estimated Value
Home Financials for this Owner
Home Financials are based on the most recent Mortgage that was taken out on this home.
Original Mortgage
$100,720
Outstanding Balance
$43,030
Interest Rate
6.82%
Mortgage Type
Stand Alone First
Estimated Equity
$287,044
Purchase Details
Closed on
Sep 28, 2001
Sold by
Allen Marton A
Bought by
Walker Sally Ann and Walker Elizabeth
Home Financials for this Owner
Home Financials are based on the most recent Mortgage that was taken out on this home.
Original Mortgage
$107,350
Interest Rate
6.77%
Purchase Details
Closed on
Oct 14, 1994
Sold by
Barlow Darryl and Barlow Jeanie
Bought by
Allen Marion A
Create a Home Valuation Report for This Property
The Home Valuation Report is an in-depth analysis detailing your home's value as well as a comparison with similar homes in the area
Home Values in the Area
Average Home Value in this Area
Purchase History
| Date | Buyer | Sale Price | Title Company |
|---|---|---|---|
| Libby Kevin P | $125,900 | -- | |
| Walker Sally Ann | $113,000 | Executive Title & Abstract I | |
| Allen Marion A | $89,000 | -- |
Source: Public Records
Mortgage History
| Date | Status | Borrower | Loan Amount |
|---|---|---|---|
| Open | Libby Kevin P | $100,720 | |
| Previous Owner | Walker Sally Ann | $107,350 |
Source: Public Records
Tax History
| Year | Tax Paid | Tax Assessment Tax Assessment Total Assessment is a certain percentage of the fair market value that is determined by local assessors to be the total taxable value of land and additions on the property. | Land | Improvement |
|---|---|---|---|---|
| 2025 | $5,079 | $190,800 | $45,000 | $145,800 |
| 2024 | $4,776 | $190,800 | $45,000 | $145,800 |
| 2023 | $4,776 | $190,800 | $45,000 | $145,800 |
| 2022 | $4,665 | $190,800 | $45,000 | $145,800 |
| 2021 | $4,646 | $190,800 | $45,000 | $145,800 |
| 2020 | $4,612 | $190,800 | $45,000 | $145,800 |
| 2019 | $4,560 | $190,800 | $45,000 | $145,800 |
| 2018 | $4,491 | $190,800 | $45,000 | $145,800 |
| 2017 | $4,407 | $190,800 | $45,000 | $145,800 |
| 2016 | $4,312 | $190,800 | $45,000 | $145,800 |
| 2015 | $4,280 | $190,800 | $45,000 | $145,800 |
| 2014 | $4,117 | $190,800 | $45,000 | $145,800 |
Source: Public Records
Map
Nearby Homes
- 7 Marjoram Dr Unit 7
- 8 Bayleaf Dr
- 67 Fawn Ct
- 10 Fawn Ct
- 4 Fawn Ct
- 909 Woodchip Rd Unit 909
- 692 Eayrestown Rd
- 201 Sandstone Ct Unit 201
- 21 Mulberry Ct
- 51 Blue Spruce Ct
- 48 Whitebirch Ct
- 39 Tynemouth Dr
- 93 Beechnut Ct
- 22 Providence Ct
- 20 Providence Ct
- 119 Kingston Dr
- 24 Estate Rd
- 238 Lincoln Ave
- 71 Kingsbridge Dr
- 81 Kingsbridge Dr
Your Personal Tour Guide
Ask me questions while you tour the home.