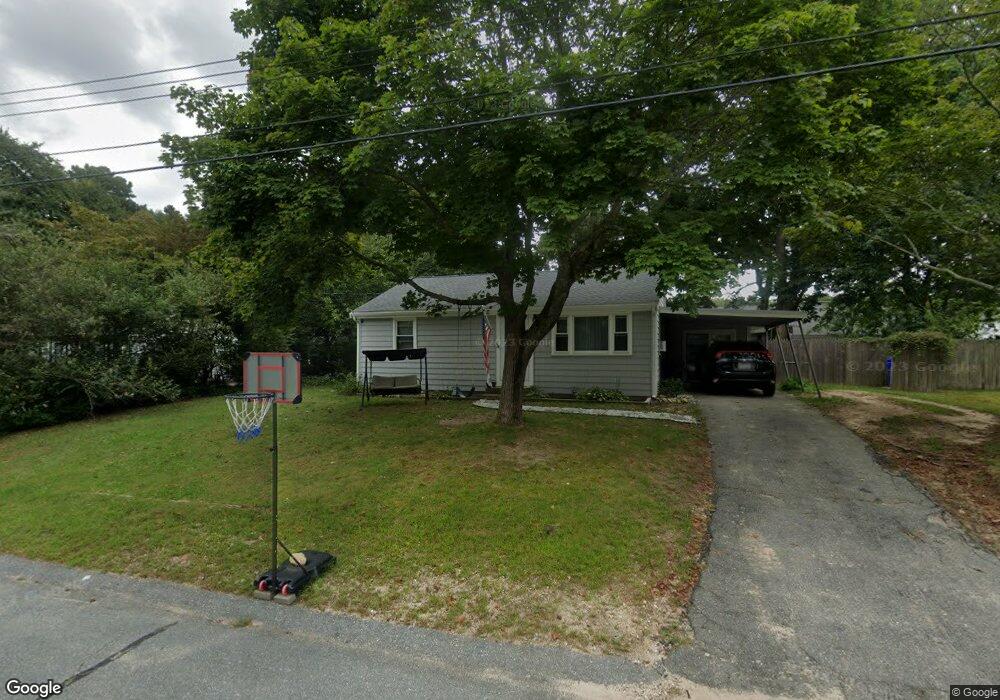
88 Handy Rd Pocasset, MA 02559
Pocasset NeighborhoodEstimated Value: $452,000 - $515,000
2
Beds
1
Bath
1,056
Sq Ft
$448/Sq Ft
Est. Value
About This Home
This home is located at 88 Handy Rd, Pocasset, MA 02559 and is currently estimated at $473,402, approximately $448 per square foot. 88 Handy Rd is a home located in Barnstable County with nearby schools including Bourne High School, Cadence Academy Preschool - Bourne, and St Margaret Regional School.
Ownership History
Date
Name
Owned For
Owner Type
Purchase Details
Closed on
Sep 21, 2021
Sold by
Circle O Llc
Bought by
Cape Commerce Nt and Macgregor
Current Estimated Value
Purchase Details
Closed on
Oct 16, 2006
Sold by
Valeri Lynn L
Bought by
Circle O Llc
Home Financials for this Owner
Home Financials are based on the most recent Mortgage that was taken out on this home.
Original Mortgage
$200,000
Interest Rate
6.47%
Mortgage Type
Purchase Money Mortgage
Purchase Details
Closed on
May 22, 2000
Sold by
Sica Vincent A and Sica Ruth
Bought by
H&K Rt
Create a Home Valuation Report for This Property
The Home Valuation Report is an in-depth analysis detailing your home's value as well as a comparison with similar homes in the area
Home Values in the Area
Average Home Value in this Area
Purchase History
| Date | Buyer | Sale Price | Title Company |
|---|---|---|---|
| Cape Commerce Nt | -- | None Available | |
| Cape Commerce Nt | -- | None Available | |
| Circle O Llc | $250,000 | -- | |
| Circle O Llc | $250,000 | -- | |
| H&K Rt | $50,000 | -- | |
| H & K Rt | $50,000 | -- |
Source: Public Records
Mortgage History
| Date | Status | Borrower | Loan Amount |
|---|---|---|---|
| Previous Owner | Circle O Llc | $200,000 | |
| Previous Owner | H & K Rt | $80,000 | |
| Previous Owner | H & K Rt | $80,000 |
Source: Public Records
Tax History Compared to Growth
Tax History
| Year | Tax Paid | Tax Assessment Tax Assessment Total Assessment is a certain percentage of the fair market value that is determined by local assessors to be the total taxable value of land and additions on the property. | Land | Improvement |
|---|---|---|---|---|
| 2025 | $3,011 | $385,500 | $191,900 | $193,600 |
| 2024 | $3,097 | $386,200 | $199,400 | $186,800 |
| 2023 | $3,013 | $342,000 | $176,500 | $165,500 |
| 2022 | $2,775 | $275,000 | $143,200 | $131,800 |
| 2021 | $2,698 | $250,500 | $130,300 | $120,200 |
| 2020 | $2,616 | $243,600 | $129,100 | $114,500 |
| 2019 | $2,494 | $237,300 | $129,100 | $108,200 |
| 2018 | $2,389 | $226,700 | $128,500 | $98,200 |
| 2017 | $2,311 | $224,400 | $127,300 | $97,100 |
| 2016 | $2,091 | $205,800 | $127,300 | $78,500 |
| 2015 | $1,683 | $167,100 | $88,600 | $78,500 |
Source: Public Records
Map
Nearby Homes
- 7 Portside Dr
- 7 4th Ave
- 15 1st St
- 174 Barlows Landing Rd
- 940 County Rd
- 940 County Rd
- 709 County Rd
- 254 Barlows Landing Rd
- 39 Bennets Neck Dr
- 1094 County Rd
- 3 Red Brook Pond Dr
- 16 Tara Terrace
- 515 County Rd
- 93 Valley Bars Rd
- 501 County Rd
- 171 Bellavista Dr
- 48 Red Brook Harbor Rd
- 22 Nairn Rd
- 1234 Route 28a
- 14 Navajo Rd