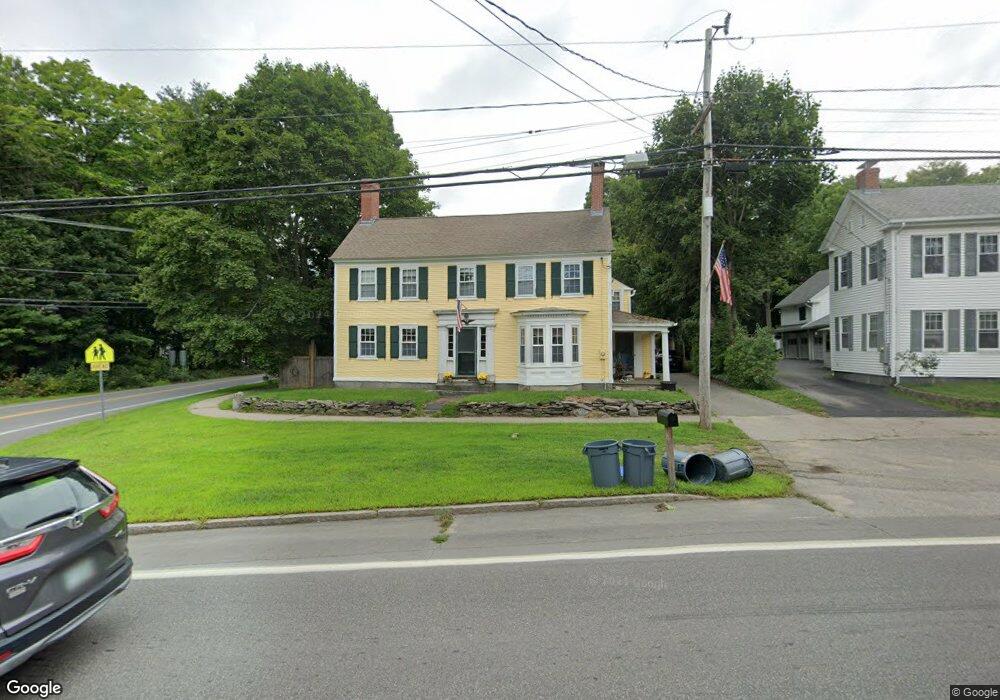
88 Main St Newfields, NH 03856
Estimated Value: $662,072 - $860,000
4
Beds
3
Baths
2,779
Sq Ft
$273/Sq Ft
Est. Value
About This Home
This home is located at 88 Main St, Newfields, NH 03856 and is currently estimated at $759,518, approximately $273 per square foot. 88 Main St is a home located in Rockingham County with nearby schools including Newfields Elementary School, Cooperative Middle School, and Exeter High School.
Ownership History
Date
Name
Owned For
Owner Type
Purchase Details
Closed on
Aug 4, 2006
Sold by
Sennott Andrea L and Sennott Sean J
Bought by
Cox Brian W and Haneman-Cox Patricia
Current Estimated Value
Purchase Details
Closed on
Apr 24, 1998
Sold by
Morse Elizabeth D
Bought by
Sennott Andrea L and Sennott Sean J
Create a Home Valuation Report for This Property
The Home Valuation Report is an in-depth analysis detailing your home's value as well as a comparison with similar homes in the area
Home Values in the Area
Average Home Value in this Area
Purchase History
| Date | Buyer | Sale Price | Title Company |
|---|---|---|---|
| Cox Brian W | $445,500 | -- | |
| Sennott Andrea L | $160,000 | -- |
Source: Public Records
Mortgage History
| Date | Status | Borrower | Loan Amount |
|---|---|---|---|
| Open | Sennott Andrea L | $220,000 | |
| Closed | Sennott Andrea L | $226,000 | |
| Closed | Sennott Andrea L | $225,499 |
Source: Public Records
Tax History
| Year | Tax Paid | Tax Assessment Tax Assessment Total Assessment is a certain percentage of the fair market value that is determined by local assessors to be the total taxable value of land and additions on the property. | Land | Improvement |
|---|---|---|---|---|
| 2025 | $10,597 | $625,200 | $196,800 | $428,400 |
| 2024 | $10,059 | $625,200 | $196,800 | $428,400 |
| 2023 | $9,872 | $625,200 | $196,800 | $428,400 |
| 2022 | $9,304 | $443,900 | $151,600 | $292,300 |
| 2021 | $9,122 | $443,900 | $151,600 | $292,300 |
| 2020 | $9,428 | $443,900 | $151,600 | $292,300 |
| 2019 | $9,140 | $443,900 | $151,600 | $292,300 |
| 2018 | $8,811 | $443,900 | $151,600 | $292,300 |
| 2017 | $9,001 | $376,000 | $151,600 | $224,400 |
| 2016 | $8,731 | $376,000 | $151,600 | $224,400 |
| 2015 | $8,659 | $376,000 | $151,600 | $224,400 |
| 2014 | $9,130 | $376,500 | $151,600 | $224,900 |
| 2013 | $9,141 | $376,500 | $151,600 | $224,900 |
Source: Public Records
Map
Nearby Homes
- 100 Exeter Rd
- 3 Swamscott St
- 57 Main St
- 10 Wingate Ct
- 85 College Rd
- 74 College Rd
- 00 Piscassic & Oaklands Rd Unit 1
- 9 Captain's Way
- 23 Winding Brook Dr
- 1 Firefly Landing
- 5 Stone Ridge Ln
- 5 Ridge Rd
- 0 Autumn Ln
- 3 Chisholm Farm Dr
- 14 Doe Run Ln
- 222 Portsmouth Ave
- 0 Pear Tree Ln Unit 9
- 0 Pear Tree Ln Unit 10
- 32 Tansy Ave
- 62 Green Rd
Your Personal Tour Guide
Ask me questions while you tour the home.