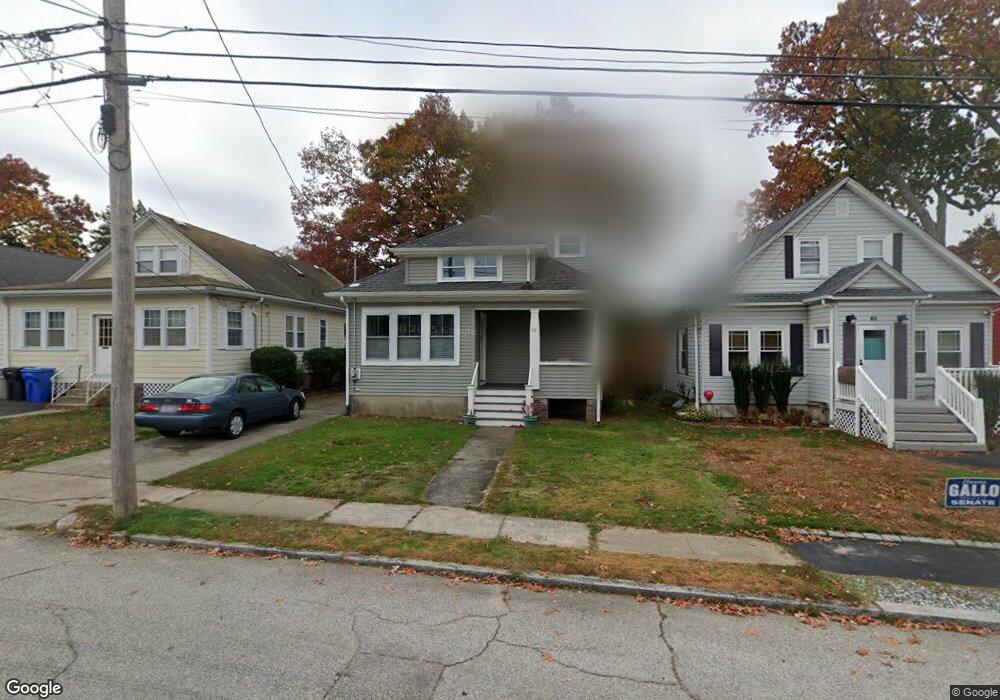
88 Myrtle Ave Cranston, RI 02910
Eden Park NeighborhoodEstimated Value: $360,240 - $471,000
1
Bed
1
Bath
1,091
Sq Ft
$367/Sq Ft
Est. Value
About This Home
This home is located at 88 Myrtle Ave, Cranston, RI 02910 and is currently estimated at $400,060, approximately $366 per square foot. 88 Myrtle Ave is a home located in Providence County with nearby schools including Park View Middle School, Cranston High School East, and Cadence Academy Preschool - Cranston.
Ownership History
Date
Name
Owned For
Owner Type
Purchase Details
Closed on
Nov 6, 2015
Sold by
Toolan Walter F
Bought by
Toolan Charles M and Toolan Claudia H
Current Estimated Value
Home Financials for this Owner
Home Financials are based on the most recent Mortgage that was taken out on this home.
Original Mortgage
$40,000
Outstanding Balance
$31,472
Interest Rate
3.88%
Estimated Equity
$368,588
Create a Home Valuation Report for This Property
The Home Valuation Report is an in-depth analysis detailing your home's value as well as a comparison with similar homes in the area
Home Values in the Area
Average Home Value in this Area
Purchase History
| Date | Buyer | Sale Price | Title Company |
|---|---|---|---|
| Toolan Charles M | $189,000 | -- |
Source: Public Records
Mortgage History
| Date | Status | Borrower | Loan Amount |
|---|---|---|---|
| Open | Toolan Charles M | $40,000 |
Source: Public Records
Tax History
| Year | Tax Paid | Tax Assessment Tax Assessment Total Assessment is a certain percentage of the fair market value that is determined by local assessors to be the total taxable value of land and additions on the property. | Land | Improvement |
|---|---|---|---|---|
| 2025 | $4,647 | $334,800 | $103,800 | $231,000 |
| 2024 | $4,557 | $334,800 | $103,800 | $231,000 |
| 2023 | $4,494 | $237,800 | $68,300 | $169,500 |
| 2022 | $4,402 | $237,800 | $68,300 | $169,500 |
| 2021 | $4,280 | $237,800 | $68,300 | $169,500 |
| 2020 | $4,154 | $200,000 | $65,100 | $134,900 |
| 2019 | $4,154 | $200,000 | $65,100 | $134,900 |
| 2018 | $4,058 | $200,000 | $65,100 | $134,900 |
| 2017 | $3,391 | $147,800 | $58,600 | $89,200 |
| 2016 | $3,318 | $147,800 | $58,600 | $89,200 |
| 2015 | $3,257 | $145,100 | $58,600 | $86,500 |
| 2014 | $2,834 | $124,100 | $58,600 | $65,500 |
Source: Public Records
Map
Nearby Homes
Your Personal Tour Guide
Ask me questions while you tour the home.