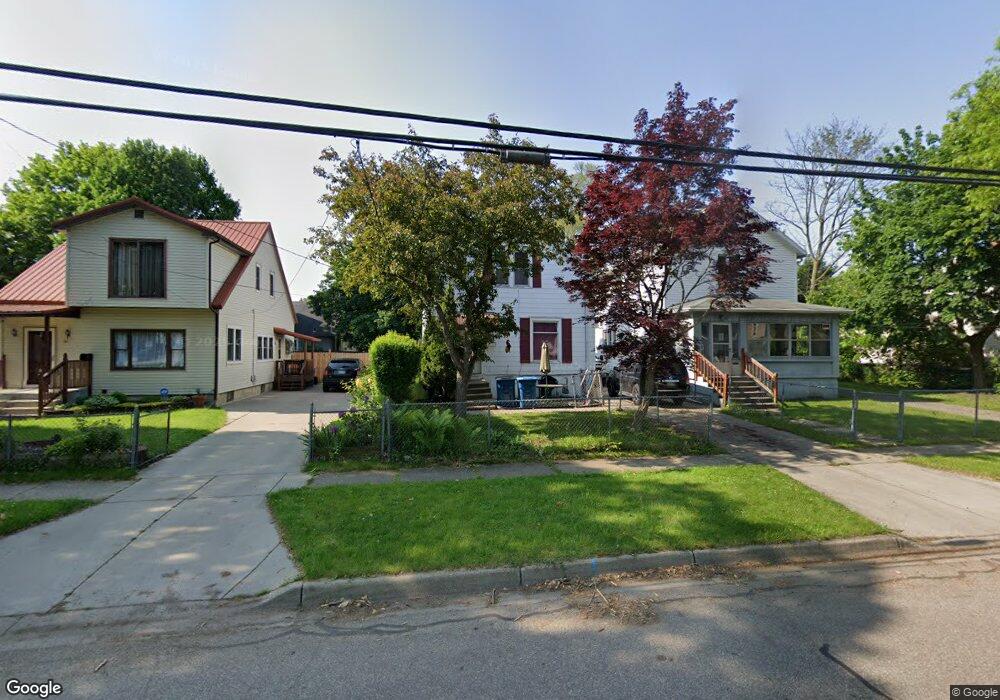
88 Post Ave Battle Creek, MI 49014
Post Franklin NeighborhoodEstimated Value: $92,788 - $115,000
3
Beds
2
Baths
1,158
Sq Ft
$89/Sq Ft
Est. Value
About This Home
This home is located at 88 Post Ave, Battle Creek, MI 49014 and is currently estimated at $102,697, approximately $88 per square foot. 88 Post Ave is a home located in Calhoun County with nearby schools including Post-Franklin Elementary School, Springfield Middle School, and Battle Creek Central High School.
Ownership History
Date
Name
Owned For
Owner Type
Purchase Details
Closed on
Apr 14, 2014
Sold by
Niniz David
Bought by
Trejo Francisco J and Trejo Karina
Current Estimated Value
Purchase Details
Closed on
Dec 7, 2007
Sold by
Mortgage Electronic Registration Systems
Bought by
Deutsche Bank National Trust Co and Holders Of Gsamp Trust 2005-He1 Mortgage
Purchase Details
Closed on
Apr 9, 2003
Sold by
Eldred Joseph E and Eldred Lisa M
Bought by
Goheen Deette L
Create a Home Valuation Report for This Property
The Home Valuation Report is an in-depth analysis detailing your home's value as well as a comparison with similar homes in the area
Home Values in the Area
Average Home Value in this Area
Purchase History
| Date | Buyer | Sale Price | Title Company |
|---|---|---|---|
| Trejo Francisco J | -- | None Listed On Document | |
| Trejo Francisco J | -- | None Listed On Document | |
| Deutsche Bank National Trust Co | -- | None Available | |
| Mortgage Electronic Registration Systems | $44,550 | None Available | |
| Goheen Deette L | $68,000 | -- |
Source: Public Records
Tax History Compared to Growth
Tax History
| Year | Tax Paid | Tax Assessment Tax Assessment Total Assessment is a certain percentage of the fair market value that is determined by local assessors to be the total taxable value of land and additions on the property. | Land | Improvement |
|---|---|---|---|---|
| 2025 | -- | $33,700 | $0 | $0 |
| 2024 | $598 | $28,792 | $0 | $0 |
| 2023 | $683 | $26,468 | $0 | $0 |
| 2022 | $540 | $22,286 | $0 | $0 |
| 2021 | $645 | $20,504 | $0 | $0 |
| 2020 | $607 | $20,349 | $0 | $0 |
| 2019 | $644 | $14,688 | $0 | $0 |
| 2018 | $644 | $13,045 | $330 | $12,715 |
| 2017 | $786 | $18,319 | $0 | $0 |
| 2016 | $784 | $16,987 | $0 | $0 |
| 2015 | $830 | $20,014 | $1,638 | $18,376 |
| 2014 | $830 | $15,047 | $1,638 | $13,409 |
Source: Public Records
Map
Nearby Homes