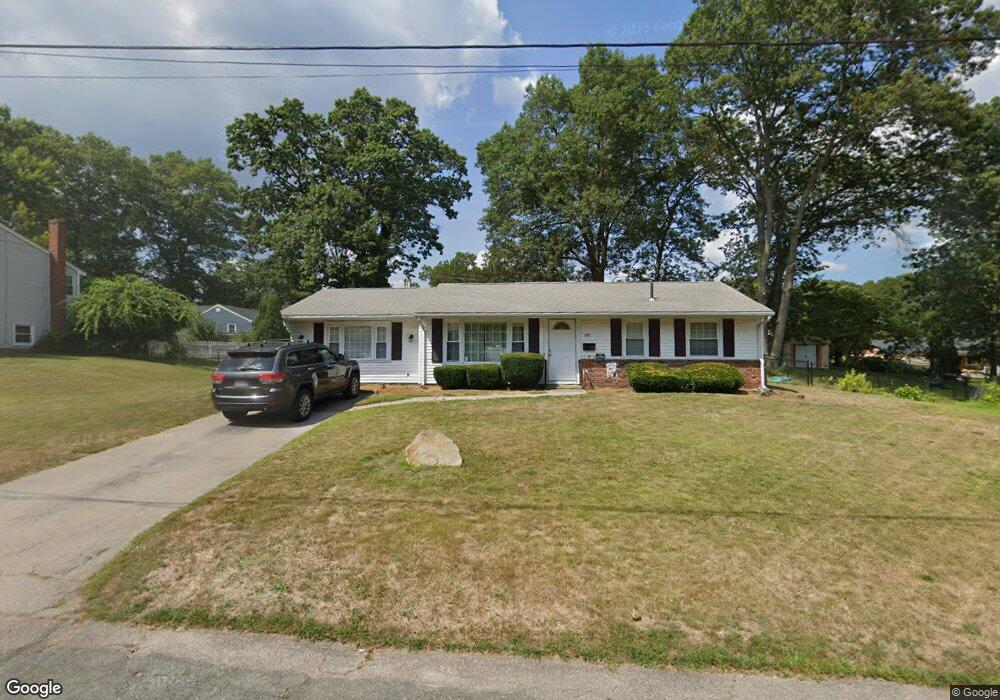
88 Regent Rd Brockton, MA 02302
Estimated Value: $463,000 - $470,000
3
Beds
1
Bath
1,216
Sq Ft
$383/Sq Ft
Est. Value
About This Home
This home is located at 88 Regent Rd, Brockton, MA 02302 and is currently estimated at $466,004, approximately $383 per square foot. 88 Regent Rd is a home located in Plymouth County with nearby schools including Brookfield Elementary School, Downey Elementary School, and Ashfield Middle School.
Ownership History
Date
Name
Owned For
Owner Type
Purchase Details
Closed on
Nov 29, 2016
Sold by
Hughes Barbara A and Hughes Paul G
Bought by
Meany Sean and Mumme Jennifer
Current Estimated Value
Home Financials for this Owner
Home Financials are based on the most recent Mortgage that was taken out on this home.
Original Mortgage
$226,010
Outstanding Balance
$182,217
Interest Rate
3.47%
Mortgage Type
New Conventional
Estimated Equity
$283,787
Purchase Details
Closed on
Aug 4, 2008
Sold by
Hughes Mary P
Bought by
Hughes Paul G and Joyce Linda J
Create a Home Valuation Report for This Property
The Home Valuation Report is an in-depth analysis detailing your home's value as well as a comparison with similar homes in the area
Home Values in the Area
Average Home Value in this Area
Purchase History
| Date | Buyer | Sale Price | Title Company |
|---|---|---|---|
| Meany Sean | $233,000 | -- | |
| Hughes Paul G | -- | -- |
Source: Public Records
Mortgage History
| Date | Status | Borrower | Loan Amount |
|---|---|---|---|
| Open | Meany Sean | $226,010 |
Source: Public Records
Tax History Compared to Growth
Tax History
| Year | Tax Paid | Tax Assessment Tax Assessment Total Assessment is a certain percentage of the fair market value that is determined by local assessors to be the total taxable value of land and additions on the property. | Land | Improvement |
|---|---|---|---|---|
| 2025 | $4,814 | $397,500 | $146,000 | $251,500 |
| 2024 | $4,652 | $387,000 | $146,000 | $241,000 |
| 2023 | $4,435 | $341,700 | $111,100 | $230,600 |
| 2022 | $4,244 | $303,800 | $101,000 | $202,800 |
| 2021 | $4,135 | $285,200 | $95,600 | $189,600 |
| 2020 | $4,075 | $269,000 | $91,600 | $177,400 |
| 2019 | $3,699 | $238,000 | $86,000 | $152,000 |
| 2018 | $3,707 | $230,800 | $86,000 | $144,800 |
| 2017 | $3,565 | $221,400 | $86,000 | $135,400 |
| 2016 | $3,106 | $178,900 | $82,100 | $96,800 |
| 2015 | $2,982 | $164,300 | $82,100 | $82,200 |
| 2014 | $2,926 | $161,400 | $82,100 | $79,300 |
Source: Public Records
Map
Nearby Homes