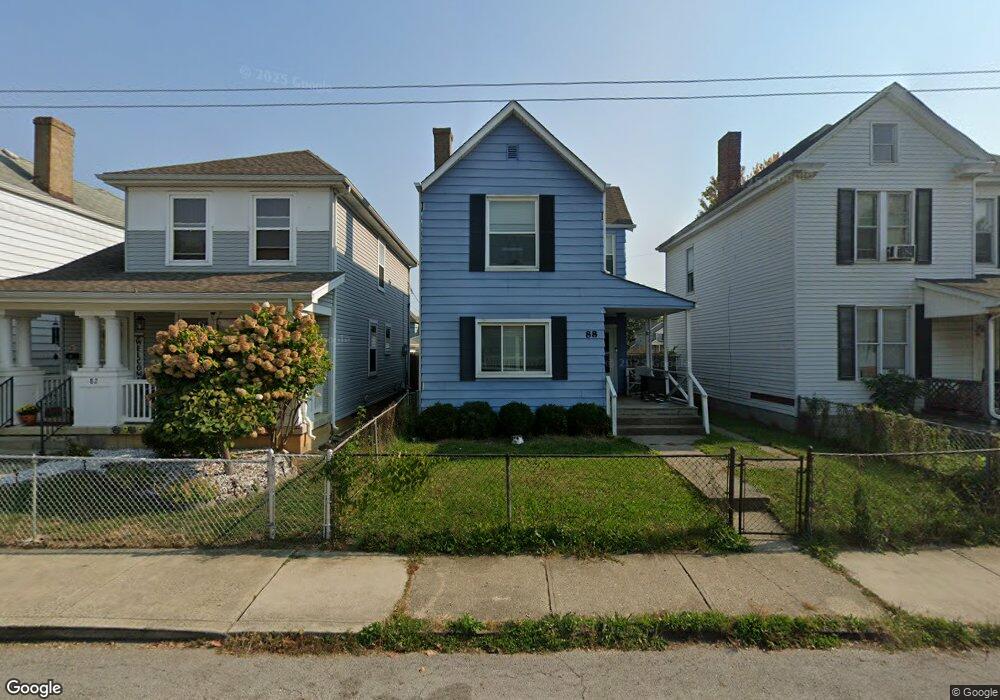
88 S Cypress Ave Columbus, OH 43222
Franklinton NeighborhoodEstimated Value: $221,676 - $338,000
3
Beds
2
Baths
1,260
Sq Ft
$207/Sq Ft
Est. Value
About This Home
This home is located at 88 S Cypress Ave, Columbus, OH 43222 and is currently estimated at $260,419, approximately $206 per square foot. 88 S Cypress Ave is a home located in Franklin County with nearby schools including Avondale Elementary School, Starling PK-8, and West High School.
Ownership History
Date
Name
Owned For
Owner Type
Purchase Details
Closed on
Mar 1, 2019
Sold by
Fton Llc
Bought by
Swisher Garrett
Current Estimated Value
Home Financials for this Owner
Home Financials are based on the most recent Mortgage that was taken out on this home.
Original Mortgage
$190,120
Outstanding Balance
$167,148
Interest Rate
4.4%
Mortgage Type
New Conventional
Estimated Equity
$93,271
Purchase Details
Closed on
Aug 21, 2018
Sold by
One 91 Holdings Llc
Bought by
Fton Llc
Home Financials for this Owner
Home Financials are based on the most recent Mortgage that was taken out on this home.
Original Mortgage
$404,150
Interest Rate
4.5%
Mortgage Type
Commercial
Purchase Details
Closed on
Nov 1, 2017
Sold by
Toops Kathy and Toops Tony
Bought by
One 91 Holdings Llc
Purchase Details
Closed on
Apr 20, 1999
Sold by
Toops Charles M and Toops Anna C
Bought by
Toops Tony and Toops Kathy
Purchase Details
Closed on
Apr 23, 1985
Bought by
Toops Charles M
Purchase Details
Closed on
Mar 1, 1985
Purchase Details
Closed on
Feb 1, 1984
Create a Home Valuation Report for This Property
The Home Valuation Report is an in-depth analysis detailing your home's value as well as a comparison with similar homes in the area
Home Values in the Area
Average Home Value in this Area
Purchase History
| Date | Buyer | Sale Price | Title Company |
|---|---|---|---|
| Swisher Garrett | $196,000 | Pm Title Box | |
| Fton Llc | -- | Allodial Title Llc | |
| One 91 Holdings Llc | $50,000 | Pm Title Box | |
| Toops Tony | -- | -- | |
| Toops Charles M | $28,000 | -- | |
| -- | -- | -- | |
| -- | -- | -- |
Source: Public Records
Mortgage History
| Date | Status | Borrower | Loan Amount |
|---|---|---|---|
| Open | Swisher Garrett | $190,120 | |
| Previous Owner | Fton Llc | $404,150 |
Source: Public Records
Tax History Compared to Growth
Tax History
| Year | Tax Paid | Tax Assessment Tax Assessment Total Assessment is a certain percentage of the fair market value that is determined by local assessors to be the total taxable value of land and additions on the property. | Land | Improvement |
|---|---|---|---|---|
| 2024 | $971 | $71,170 | $6,620 | $64,550 |
| 2023 | $959 | $71,155 | $6,615 | $64,540 |
| 2022 | $839 | $66,760 | $1,160 | $65,600 |
| 2021 | $841 | $66,760 | $1,160 | $65,600 |
| 2020 | $842 | $66,760 | $1,160 | $65,600 |
| 2019 | $993 | $55,630 | $950 | $54,680 |
| 2018 | $823 | $15,970 | $950 | $15,020 |
| 2017 | $642 | $10,120 | $950 | $9,170 |
| 2016 | $670 | $10,120 | $1,470 | $8,650 |
| 2015 | $609 | $10,120 | $1,470 | $8,650 |
| 2014 | $610 | $10,120 | $1,470 | $8,650 |
| 2013 | $334 | $11,235 | $1,645 | $9,590 |
Source: Public Records
Map
Nearby Homes
- 61 Dakota Ave
- 112 S Cypress Ave
- 72 Avondale Ave
- 53-55 Hawkes Ave
- 49 S Yale Ave
- 78 Hawkes Ave
- 37-39 S Yale Ave
- 211 Dakota Ave
- 186 Avondale Ave Unit 188
- 69 Rodgers Ave
- 148 W Park Ave
- 116 W Park Ave
- The Summit Plan at Homes on Hartford - Single Family
- 49 S Hartford Ave
- 45 S Hartford Ave
- 221 S Yale Ave
- 45 N Hartford Ave
- 1020-1026 Cable Ave
- 82 N Princeton Ave
- 33 N Hartford Ave
- 82 S Cypress Ave
- 82 S Cypress Ave Unit 82
- 92 S Cypress Ave
- 80 S Cypress Ave
- 76 S Cypress Ave
- 0 W State St
- 70 S Cypress Ave
- 104 S Cypress Ave
- 91 S Cypress Ave Unit 91
- 85 Dakota Ave Unit 87
- 93 Dakota Ave
- 83 Dakota Ave
- 79 Dakota Ave
- 108 S Cypress Ave
- 87 Dakota Ave Unit 87
- 85 S Cypress Ave
- 73 Dakota Ave
- 105 Dakota Ave Unit 107
- 85-87 S Cypress Ave
- 110 S Cypress Ave