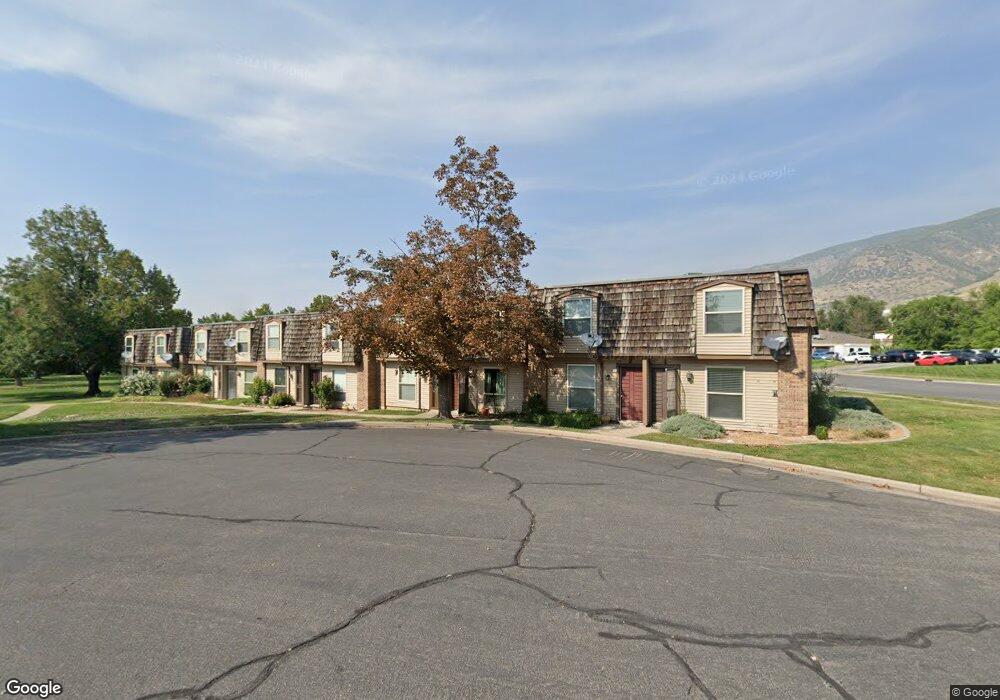
88 W 50 S Centerville, UT 84014
Estimated Value: $261,381 - $279,000
2
Beds
1
Bath
976
Sq Ft
$277/Sq Ft
Est. Value
About This Home
This home is located at 88 W 50 S, Centerville, UT 84014 and is currently estimated at $270,345, approximately $276 per square foot. 88 W 50 S is a home located in Davis County with nearby schools including J A Taylor Elementary School, Centerville Jr High, and Viewmont High School.
Ownership History
Date
Name
Owned For
Owner Type
Purchase Details
Closed on
Sep 19, 2016
Sold by
Naylor Seth C
Bought by
Naylor Coleman and Naylor Living Trust
Current Estimated Value
Home Financials for this Owner
Home Financials are based on the most recent Mortgage that was taken out on this home.
Original Mortgage
$313,310
Interest Rate
3.43%
Mortgage Type
New Conventional
Purchase Details
Closed on
Aug 26, 2016
Sold by
Seth Coleman Naylor Living Trust
Bought by
Brinhall Jacob I and Brinhall Carly R
Home Financials for this Owner
Home Financials are based on the most recent Mortgage that was taken out on this home.
Original Mortgage
$313,310
Interest Rate
3.43%
Mortgage Type
New Conventional
Purchase Details
Closed on
Jan 22, 2000
Sold by
Naylor Seth C and Naylor Valerie
Bought by
Naylor Seth C
Home Financials for this Owner
Home Financials are based on the most recent Mortgage that was taken out on this home.
Original Mortgage
$15,000
Interest Rate
7.84%
Mortgage Type
Purchase Money Mortgage
Create a Home Valuation Report for This Property
The Home Valuation Report is an in-depth analysis detailing your home's value as well as a comparison with similar homes in the area
Purchase History
| Date | Buyer | Sale Price | Title Company |
|---|---|---|---|
| Naylor Coleman | -- | None Available | |
| Brinhall Jacob I | -- | None Listed On Document | |
| Naylor Seth C | -- | Associated Title Company |
Source: Public Records
Mortgage History
| Date | Status | Borrower | Loan Amount |
|---|---|---|---|
| Previous Owner | Brinhall Jacob I | $313,310 | |
| Previous Owner | Naylor Seth C | $15,000 |
Source: Public Records
Tax History
| Year | Tax Paid | Tax Assessment Tax Assessment Total Assessment is a certain percentage of the fair market value that is determined by local assessors to be the total taxable value of land and additions on the property. | Land | Improvement |
|---|---|---|---|---|
| 2025 | $1,466 | $140,250 | $0 | $140,250 |
| 2024 | $1,509 | $146,850 | $0 | $146,850 |
| 2023 | $1,451 | $255,000 | $0 | $255,000 |
| 2022 | $1,443 | $254,000 | $60,000 | $194,000 |
| 2021 | $292 | $196,000 | $60,000 | $136,000 |
| 2020 | $1,121 | $169,000 | $41,600 | $127,400 |
| 2019 | $1,060 | $156,000 | $40,000 | $116,000 |
| 2018 | $921 | $134,000 | $34,000 | $100,000 |
| 2016 | $68 | $57,915 | $12,650 | $45,265 |
| 2015 | $718 | $54,780 | $12,650 | $42,130 |
| 2014 | $705 | $54,976 | $18,333 | $36,643 |
| 2013 | -- | $59,213 | $14,025 | $45,188 |
Source: Public Records
Map
Nearby Homes
- 88 W 50 S Unit A4
- 88 W 50 S Unit C-3
- 88 W 50 S Unit B5
- 56 W 200 N
- 330 W Paradiso Ln
- 147 N 360 W Unit 21
- 324 S 600 W
- 360 E Center St
- 328 E 1100 S
- 287 S 680 W Unit 9
- 252 N 400 E
- 345 E 600 S
- 380 E 400 N
- 282 W 605 N Unit I
- 204 Lyman Ln
- 295 E 500 N
- 83 W 850 S
- 281 W 650 N Unit B
- 303 W 650 N Unit I
- 495 E 475 S
Your Personal Tour Guide
Ask me questions while you tour the home.