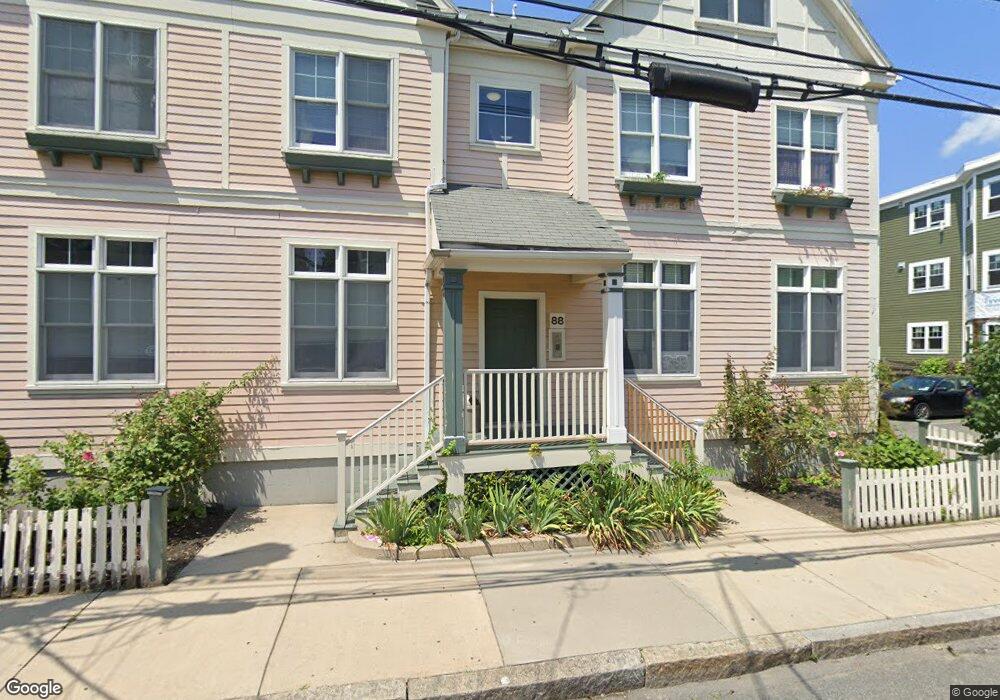
88 Wheatland St Unit 2 Somerville, MA 02145
Ten Hills NeighborhoodEstimated Value: $273,000 - $547,000
1
Bed
1
Bath
707
Sq Ft
$552/Sq Ft
Est. Value
About This Home
This home is located at 88 Wheatland St Unit 2, Somerville, MA 02145 and is currently estimated at $390,272, approximately $552 per square foot. 88 Wheatland St Unit 2 is a home located in Middlesex County with nearby schools including Somerville High School, Prospect Hill Academy Upper Elementary Campus, and Bright Future Educare Center.
Ownership History
Date
Name
Owned For
Owner Type
Purchase Details
Closed on
Feb 11, 2021
Sold by
Manzelli Lori
Bought by
Green Lindsey
Current Estimated Value
Home Financials for this Owner
Home Financials are based on the most recent Mortgage that was taken out on this home.
Original Mortgage
$140,438
Outstanding Balance
$125,606
Interest Rate
2.7%
Mortgage Type
Purchase Money Mortgage
Estimated Equity
$264,666
Purchase Details
Closed on
Oct 3, 2014
Sold by
Manzelli George A Jr E and Rogers Donna M
Bought by
Manzelli Lori
Home Financials for this Owner
Home Financials are based on the most recent Mortgage that was taken out on this home.
Original Mortgage
$107,000
Interest Rate
4.11%
Mortgage Type
New Conventional
Purchase Details
Closed on
Nov 2, 2001
Sold by
Somerville Comm Corp
Bought by
Manzelli George A
Home Financials for this Owner
Home Financials are based on the most recent Mortgage that was taken out on this home.
Original Mortgage
$78,000
Interest Rate
6.82%
Mortgage Type
Purchase Money Mortgage
Create a Home Valuation Report for This Property
The Home Valuation Report is an in-depth analysis detailing your home's value as well as a comparison with similar homes in the area
Home Values in the Area
Average Home Value in this Area
Purchase History
| Date | Buyer | Sale Price | Title Company |
|---|---|---|---|
| Green Lindsey | $144,789 | None Available | |
| Manzelli Lori | $110,345 | -- | |
| Manzelli George A | $98,000 | -- |
Source: Public Records
Mortgage History
| Date | Status | Borrower | Loan Amount |
|---|---|---|---|
| Open | Green Lindsey | $140,438 | |
| Previous Owner | Manzelli Lori | $107,000 | |
| Previous Owner | Manzelli George A | $78,000 |
Source: Public Records
Tax History Compared to Growth
Tax History
| Year | Tax Paid | Tax Assessment Tax Assessment Total Assessment is a certain percentage of the fair market value that is determined by local assessors to be the total taxable value of land and additions on the property. | Land | Improvement |
|---|---|---|---|---|
| 2025 | $1,298 | $119,000 | $0 | $119,000 |
| 2024 | $1,252 | $119,000 | $0 | $119,000 |
| 2023 | $1,203 | $116,300 | $0 | $116,300 |
| 2022 | $1,184 | $116,300 | $0 | $116,300 |
| 2021 | $1,185 | $116,300 | $0 | $116,300 |
| 2020 | $1,173 | $116,300 | $0 | $116,300 |
| 2019 | $1,251 | $116,300 | $0 | $116,300 |
| 2018 | $1,315 | $116,300 | $0 | $116,300 |
| 2017 | $1,287 | $110,300 | $0 | $110,300 |
| 2016 | $1,373 | $109,600 | $0 | $109,600 |
| 2015 | $1,528 | $121,200 | $0 | $121,200 |
Source: Public Records
Map
Nearby Homes
- 77 Wheatland St Unit 2
- 30A Summer
- 84 Grant St Unit 7
- 7 Jaques St
- 41 Bailey Rd
- 34 Governor Winthrop Rd Unit 2
- 72 Governor Winthrop Rd Unit 2
- 60 Cross St E Unit 207
- 60 Cross St E Unit 315
- 13 Sargent Ave Unit 2
- 94 Jaques St Unit B
- 11 Macarthur St Unit B
- 11 Macarthur St Unit A
- 73 Bonair St
- 176-182 Broadway
- 29 Fenwick St
- 19 Fenwick St Unit 4
- 59 Dartmouth St Unit A
- 7 Rhode Island Ave
- 10 Cross Street Place Unit 3
- 88 Wheatland St Unit 8
- 88 Wheatland St Unit 7
- 88 Wheatland St Unit 6
- 88 Wheatland St Unit 5
- 88 Wheatland St Unit 4
- 88 Wheatland St Unit 3
- 88 Wheatland St Unit 1
- 84 Wheatland St
- 96 Wheatland St
- 96 Wheatland St Unit 3
- 96 Wheatland St Unit 2
- 96 Wheatland St Unit 1
- 82 Wheatland St
- 82 Wheatland St Unit 2
- 89 Grant St Unit 1
- 87 Grant St Unit 2
- 89 Grant St
- 87 Grant St Unit 1
- 89 Grant St Unit 2
- 87 Grant St