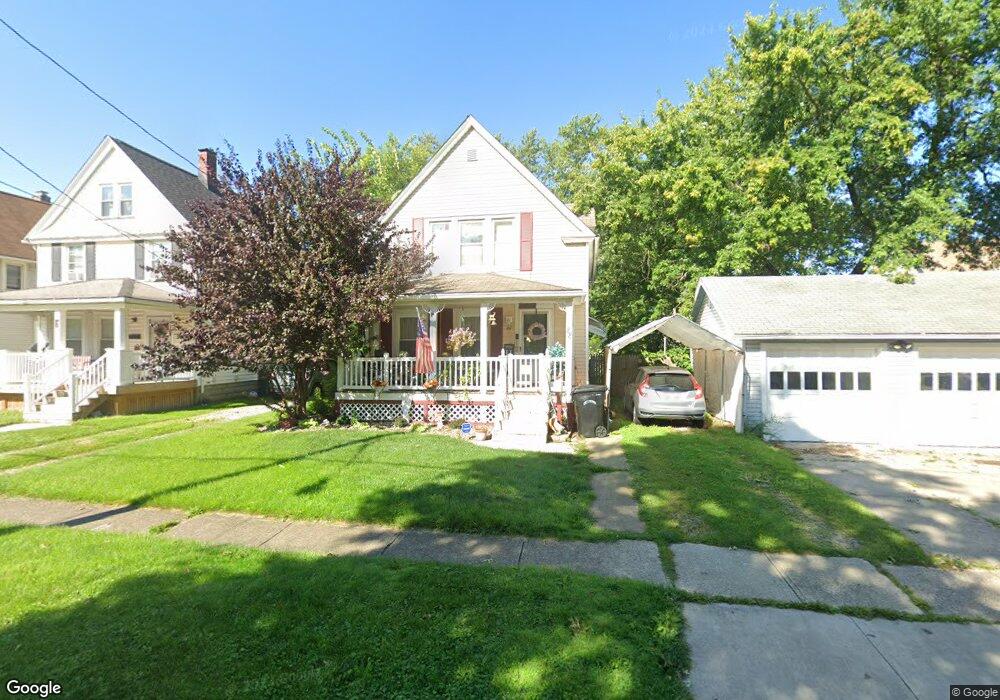
88 Williams St Elyria, OH 44035
Estimated Value: $120,000 - $149,000
3
Beds
2
Baths
1,217
Sq Ft
$109/Sq Ft
Est. Value
About This Home
This home is located at 88 Williams St, Elyria, OH 44035 and is currently estimated at $132,246, approximately $108 per square foot. 88 Williams St is a home located in Lorain County with nearby schools including Eastern Heights Middle School, Elyria High School, and Constellation Schools: Elyria Community Elementary.
Ownership History
Date
Name
Owned For
Owner Type
Purchase Details
Closed on
Feb 6, 2026
Sold by
Elbert David Robert
Bought by
Berry David A
Current Estimated Value
Purchase Details
Closed on
Feb 12, 2003
Sold by
Elbert Robert J and Elbert Catherine R
Bought by
Alheit Gary and Alheit Roberta K
Home Financials for this Owner
Home Financials are based on the most recent Mortgage that was taken out on this home.
Original Mortgage
$59,500
Interest Rate
5.94%
Purchase Details
Closed on
Jun 11, 2002
Sold by
Elbert Robert J and Elbert Robert Joseph
Bought by
Elbert Catherine R and Elbert Catherine Rosella
Create a Home Valuation Report for This Property
The Home Valuation Report is an in-depth analysis detailing your home's value as well as a comparison with similar homes in the area
Home Values in the Area
Average Home Value in this Area
Purchase History
| Date | Buyer | Sale Price | Title Company |
|---|---|---|---|
| Berry David A | $40,000 | None Listed On Document | |
| Alheit Gary | $70,000 | Real Estate Title | |
| Elbert Catherine R | -- | -- |
Source: Public Records
Mortgage History
| Date | Status | Borrower | Loan Amount |
|---|---|---|---|
| Previous Owner | Alheit Gary | $59,500 |
Source: Public Records
Tax History
| Year | Tax Paid | Tax Assessment Tax Assessment Total Assessment is a certain percentage of the fair market value that is determined by local assessors to be the total taxable value of land and additions on the property. | Land | Improvement |
|---|---|---|---|---|
| 2024 | $1,345 | $38,224 | $4,498 | $33,726 |
| 2023 | $1,060 | $28,620 | $3,423 | $25,197 |
| 2022 | $1,079 | $28,620 | $3,423 | $25,197 |
| 2021 | $1,081 | $28,620 | $3,420 | $25,200 |
| 2020 | $963 | $24,480 | $2,930 | $21,550 |
| 2019 | $957 | $24,480 | $2,930 | $21,550 |
| 2018 | $852 | $24,480 | $2,930 | $21,550 |
| 2017 | $745 | $20,470 | $3,220 | $17,250 |
| 2016 | $735 | $20,470 | $3,220 | $17,250 |
| 2015 | $688 | $20,470 | $3,220 | $17,250 |
| 2014 | $669 | $20,270 | $3,190 | $17,080 |
| 2013 | $662 | $20,270 | $3,190 | $17,080 |
Source: Public Records
Map
Nearby Homes
Your Personal Tour Guide
Ask me questions while you tour the home.