880 Bellemeade Place Alpharetta, GA 30004
Estimated Value: $582,000 - $636,842
4
Beds
4
Baths
2,404
Sq Ft
$252/Sq Ft
Est. Value
About This Home
This home is located at 880 Bellemeade Place, Alpharetta, GA 30004 and is currently estimated at $606,211, approximately $252 per square foot. 880 Bellemeade Place is a home located in Forsyth County with nearby schools including Brandywine Elementary School, DeSana Middle School, and Denmark High School.
Ownership History
Date
Name
Owned For
Owner Type
Purchase Details
Closed on
Jun 23, 2006
Sold by
Bumpus Jeremy R and Bumpus Melanie A
Bought by
Putman Leith A and Putman Troy D
Current Estimated Value
Home Financials for this Owner
Home Financials are based on the most recent Mortgage that was taken out on this home.
Original Mortgage
$50,000
Interest Rate
6.57%
Mortgage Type
New Conventional
Purchase Details
Closed on
Oct 20, 2000
Sold by
D R Horton Inc & Torrey
Bought by
Bumpus Jeremy R and Bumpus Melanie A
Home Financials for this Owner
Home Financials are based on the most recent Mortgage that was taken out on this home.
Original Mortgage
$204,540
Interest Rate
7.91%
Mortgage Type
New Conventional
Create a Home Valuation Report for This Property
The Home Valuation Report is an in-depth analysis detailing your home's value as well as a comparison with similar homes in the area
Home Values in the Area
Average Home Value in this Area
Purchase History
| Date | Buyer | Sale Price | Title Company |
|---|---|---|---|
| Putman Leith A | $307,400 | -- | |
| Bumpus Jeremy R | $255,700 | -- |
Source: Public Records
Mortgage History
| Date | Status | Borrower | Loan Amount |
|---|---|---|---|
| Open | Putman Leigh Ann | $312,000 | |
| Closed | Putman Troy D | $248,300 | |
| Closed | Putman Leith A | $50,000 | |
| Previous Owner | Bumpus Ijeremy R | $90,000 | |
| Previous Owner | Bumpus Jeremy R | $229,000 | |
| Previous Owner | Bumpus Jeremy R | $22,100 | |
| Previous Owner | Bumpus Jeremy R | $229,850 | |
| Previous Owner | Bumpus Jeremy R | $204,540 |
Source: Public Records
Tax History Compared to Growth
Tax History
| Year | Tax Paid | Tax Assessment Tax Assessment Total Assessment is a certain percentage of the fair market value that is determined by local assessors to be the total taxable value of land and additions on the property. | Land | Improvement |
|---|---|---|---|---|
| 2024 | $4,731 | $234,348 | $60,000 | $174,348 |
| 2023 | $4,116 | $218,476 | $60,000 | $158,476 |
| 2022 | $4,241 | $147,416 | $40,000 | $107,416 |
| 2021 | $3,701 | $147,416 | $40,000 | $107,416 |
| 2020 | $3,524 | $138,848 | $32,000 | $106,848 |
| 2019 | $3,471 | $136,000 | $32,000 | $104,000 |
| 2018 | $3,360 | $130,140 | $32,000 | $98,140 |
| 2017 | $3,069 | $115,736 | $32,000 | $83,736 |
| 2016 | $3,141 | $119,136 | $28,000 | $91,136 |
| 2015 | $3,146 | $119,136 | $28,000 | $91,136 |
| 2014 | $2,755 | $107,396 | $0 | $0 |
Source: Public Records
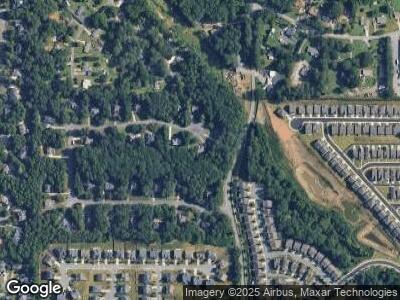
Map
Nearby Homes
- 925 Hargrove Point Way
- 1145 Ledmark Ct
- 860 Hargrove Point Way
- 1040 Poppy Pointe
- 1040 Peyton View Ct
- 315 Aurelia Trace
- 3692 Archgate Ct
- 785 Armstead Terrace
- 575 Gale Ct
- 845 Vintner Ct
- 195 Galecrest Dr
- 3350 Serenade Ct
- 13943 Sunfish Bend
- 715 Alstonefield Dr
- 205 Lembeth Ct
- 3380 Galleon Dr
- 13333 Flamingo Rd
- 215 Fernbank St
- 1095 S Bethany Creek Dr
- 880 Bellemeade Place
- 885 Bellemeade Place
- 870 Bellemeade Place
- 710 Bellemeade Place
- 720 Bellemeade Place
- 875 Bellemeade Place
- 730 Bellemeade Place
- 1085 Hargrove Point Way
- 865 Bellemeade Place
- 860 Bellemeade Place
- 1075 Hargrove Point Way
- 1065 Hargrove Point Way
- 1100 Pine Crest Terrace
- 0 Bellemeade Place Unit 7484164
- 0 Bellemeade Place Unit 7440503
- 0 Bellemeade Place Unit 3269850
- 0 Bellemeade Place Unit 8334640
- 0 Bellemeade Place Unit 8193282
- 0 Bellemeade Place Unit 8045230
- 0 Bellemeade Place Unit 8843866