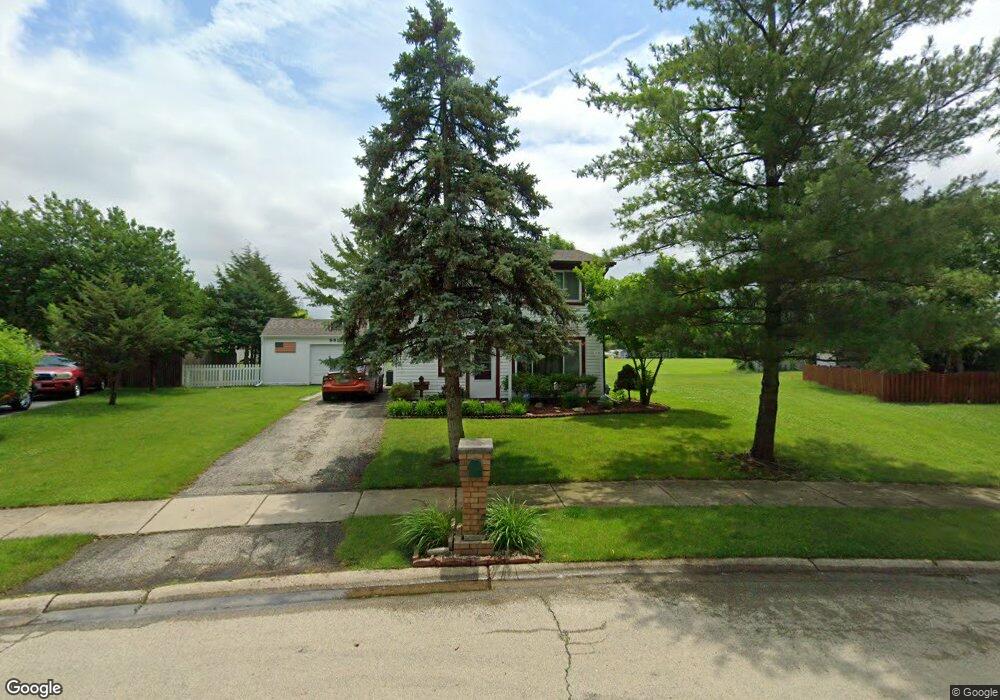
880 Cloverfield Ln Unit 13B Aurora, IL 60504
South East Village NeighborhoodEstimated Value: $272,000 - $307,000
3
Beds
2
Baths
1,296
Sq Ft
$225/Sq Ft
Est. Value
About This Home
This home is located at 880 Cloverfield Ln Unit 13B, Aurora, IL 60504 and is currently estimated at $291,590, approximately $224 per square foot. 880 Cloverfield Ln Unit 13B is a home located in DuPage County with nearby schools including Georgetown Elementary School, Fischer Middle School, and Waubonsie Valley High School.
Ownership History
Date
Name
Owned For
Owner Type
Purchase Details
Closed on
Jun 10, 2004
Sold by
Lindaur Ryan J and Lindaur Lida
Bought by
Ocampo Belen
Current Estimated Value
Home Financials for this Owner
Home Financials are based on the most recent Mortgage that was taken out on this home.
Original Mortgage
$102,750
Outstanding Balance
$50,800
Interest Rate
6.17%
Mortgage Type
Purchase Money Mortgage
Estimated Equity
$240,790
Purchase Details
Closed on
Aug 17, 2001
Sold by
Eakins Randall L and Eakins Susan P
Bought by
Lindaur Ryan J
Home Financials for this Owner
Home Financials are based on the most recent Mortgage that was taken out on this home.
Original Mortgage
$99,600
Interest Rate
7.03%
Create a Home Valuation Report for This Property
The Home Valuation Report is an in-depth analysis detailing your home's value as well as a comparison with similar homes in the area
Home Values in the Area
Average Home Value in this Area
Purchase History
| Date | Buyer | Sale Price | Title Company |
|---|---|---|---|
| Ocampo Belen | $161,500 | First American Title | |
| Lindaur Ryan J | $124,500 | First American Title Ins |
Source: Public Records
Mortgage History
| Date | Status | Borrower | Loan Amount |
|---|---|---|---|
| Open | Ocampo Belen | $102,750 | |
| Previous Owner | Lindaur Ryan J | $99,600 | |
| Closed | Lindaur Ryan J | $18,675 | |
| Closed | Ocampo Belen | $51,680 |
Source: Public Records
Tax History Compared to Growth
Tax History
| Year | Tax Paid | Tax Assessment Tax Assessment Total Assessment is a certain percentage of the fair market value that is determined by local assessors to be the total taxable value of land and additions on the property. | Land | Improvement |
|---|---|---|---|---|
| 2024 | $5,606 | $81,731 | $26,164 | $55,567 |
| 2023 | $5,318 | $73,440 | $23,510 | $49,930 |
| 2022 | $4,882 | $64,220 | $21,160 | $43,060 |
| 2021 | $4,744 | $61,920 | $20,400 | $41,520 |
| 2020 | $4,802 | $61,920 | $20,400 | $41,520 |
| 2019 | $4,620 | $58,890 | $19,400 | $39,490 |
| 2018 | $3,953 | $50,750 | $16,600 | $34,150 |
| 2017 | $3,608 | $46,040 | $15,060 | $30,980 |
| 2016 | $3,530 | $44,180 | $14,450 | $29,730 |
| 2015 | $3,477 | $41,950 | $13,720 | $28,230 |
| 2014 | $3,660 | $42,730 | $13,870 | $28,860 |
| 2013 | $3,624 | $43,030 | $13,970 | $29,060 |
Source: Public Records
Map
Nearby Homes
- 3140 Medford Ct
- 2950 Shelly Ln Unit 2950
- 2901 Shelly Ln
- 3467 Charlemaine Dr
- 2750 Shelly Ln
- 3479 Charlemaine Dr
- 441 Park Ridge Ln Unit C
- 3131 Portland Ct
- 1334 Normantown Rd Unit 334
- 3132 Portland Ct
- 1335 Lawrence Ct
- 164 Park Ridge Ln
- 300 Churchill Ln
- 205 Churchill Ln
- 573 Watercress Dr
- 1465 Bridgeport Ln Unit 19D
- 2860 Bridgeport Ln Unit 19D
- 3290 Johnsbury Ct
- 1348 Amaranth Dr
- 2476 Village Ct Unit 2
- 870 Cloverfield Ln
- 890 Cloverfield Ln
- 860 Cloverfield Ln
- 900 Camden Ln
- 865 Cloverfield Ln Unit 13B
- 870 Camden Ln
- 850 Cloverfield Ln
- 910 Camden Ln
- 860 Camden Ln Unit 13B
- 845 Cloverfield Ln Unit 13B
- 3260 Rumford Ct
- 840 Cloverfield Ln Unit 13B
- 3270 Allspice Ct Unit 13C
- 920 Camden Ln Unit 13B
- 895 Camden Ln Unit 13B
- 905 Camden Ln Unit 13B
- 3275 Allspice Ct Unit 13C
- 3272 Allspice Ct Unit 13C
- 850 Camden Ln
- 835 Cloverfield Ln