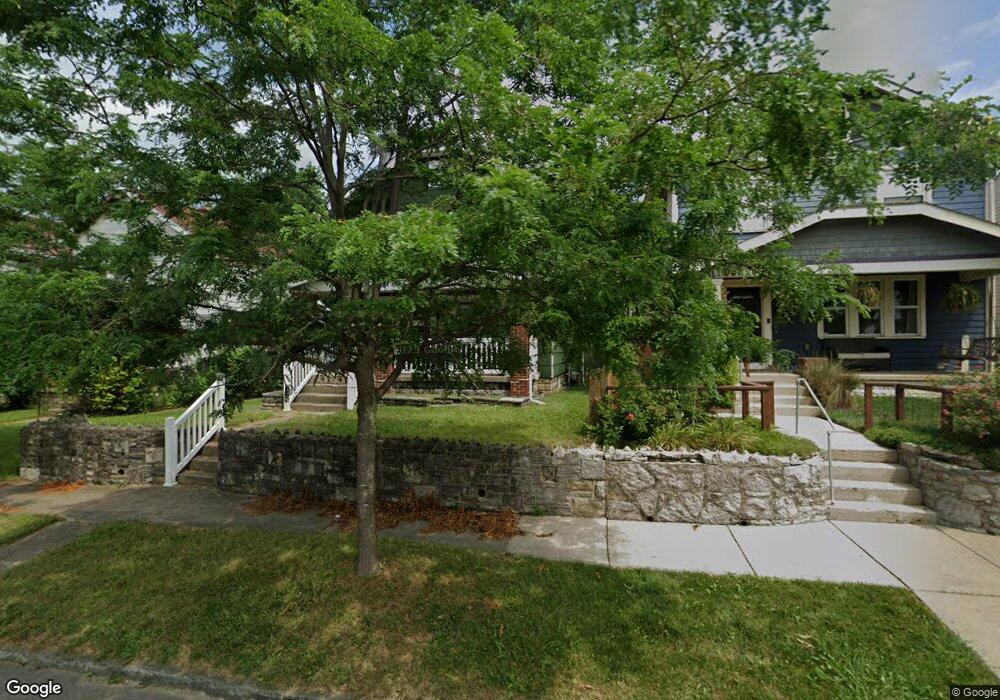
880 Gibbard Ave Columbus, OH 43201
Milo-Grogan NeighborhoodEstimated Value: $135,000 - $175,000
3
Beds
1
Bath
1,180
Sq Ft
$132/Sq Ft
Est. Value
About This Home
This home is located at 880 Gibbard Ave, Columbus, OH 43201 and is currently estimated at $156,216, approximately $132 per square foot. 880 Gibbard Ave is a home located in Franklin County with nearby schools including Windsor Stem Acadmey, Linden-Mckinley Stem School On Arcadia, and Columbus Performance Academy.
Ownership History
Date
Name
Owned For
Owner Type
Purchase Details
Closed on
Jul 30, 2007
Sold by
Sciore Marilyn L
Bought by
Mixon Jeffery D
Current Estimated Value
Home Financials for this Owner
Home Financials are based on the most recent Mortgage that was taken out on this home.
Original Mortgage
$73,000
Outstanding Balance
$46,338
Interest Rate
6.71%
Mortgage Type
Purchase Money Mortgage
Estimated Equity
$109,878
Purchase Details
Closed on
Jan 24, 2006
Sold by
Sciore Doris A
Bought by
Sciore Cornelius J
Purchase Details
Closed on
Nov 17, 1999
Sold by
Sciore Donald P
Bought by
Sciore Doris A
Purchase Details
Closed on
Nov 16, 1999
Sold by
Estate Of Mary M Sciore
Bought by
Sciore Doris A and Bernardo Rosemary A
Purchase Details
Closed on
Nov 12, 1999
Sold by
Sciore Cornelius J
Bought by
Sciore Doris A
Purchase Details
Closed on
Jul 17, 1970
Bought by
Sciore Mary M
Create a Home Valuation Report for This Property
The Home Valuation Report is an in-depth analysis detailing your home's value as well as a comparison with similar homes in the area
Home Values in the Area
Average Home Value in this Area
Purchase History
| Date | Buyer | Sale Price | Title Company |
|---|---|---|---|
| Mixon Jeffery D | $73,000 | Attorney | |
| Sciore Cornelius J | $66,300 | None Available | |
| Sciore Doris A | -- | -- | |
| Sciore Doris A | -- | -- | |
| Sciore Doris A | -- | -- | |
| Sciore Doris A | -- | -- | |
| Sciore Mary M | -- | -- |
Source: Public Records
Mortgage History
| Date | Status | Borrower | Loan Amount |
|---|---|---|---|
| Open | Mixon Jeffery D | $73,000 |
Source: Public Records
Tax History Compared to Growth
Tax History
| Year | Tax Paid | Tax Assessment Tax Assessment Total Assessment is a certain percentage of the fair market value that is determined by local assessors to be the total taxable value of land and additions on the property. | Land | Improvement |
|---|---|---|---|---|
| 2024 | $1,257 | $28,000 | $5,180 | $22,820 |
| 2023 | $1,355 | $30,590 | $5,180 | $25,410 |
| 2022 | $503 | $9,700 | $2,140 | $7,560 |
| 2021 | $504 | $9,700 | $2,140 | $7,560 |
| 2020 | $505 | $9,700 | $2,140 | $7,560 |
| 2019 | $510 | $8,410 | $1,860 | $6,550 |
| 2018 | $872 | $10,610 | $1,860 | $8,750 |
| 2017 | $643 | $10,610 | $1,860 | $8,750 |
| 2016 | $1,213 | $18,310 | $2,350 | $15,960 |
| 2015 | $1,101 | $18,310 | $2,350 | $15,960 |
| 2014 | $1,104 | $18,310 | $2,350 | $15,960 |
| 2013 | $544 | $18,305 | $2,345 | $15,960 |
Source: Public Records
Map
Nearby Homes
- 879 E 4th Ave
- 997-999 Gibbard Ave
- 810-812 E 3rd Ave
- 780-782 Gibbard Ave
- 808 E Starr Ave
- 841 Saint Clair Ave
- 773-775 E 3rd Ave
- 1025 Howard St
- 1112 Peters Ave
- 940 Shoemaker Ave
- 1158 Lexington Ave
- 650 E 3rd Ave
- 570 Reynolds Ave
- 574 Reynolds Ave Unit 6
- 927 Camden Ave
- 923 Camden Ave
- 911 Camden Ave
- 276 E 4th Ave
- 0 Leona Ave
- 472 Reynolds Ave Unit 474
- 874 Gibbard Ave
- 888 Gibbard Ave
- 870 Gibbard Ave
- 892 Gibbard Ave
- 866 Gibbard Ave
- 862 Gibbard Ave
- 889 E 4th Ave
- 858 Gibbard Ave
- 895 E 4th Ave Unit 897
- 873 E 4th Ave
- 854 Gibbard Ave
- 869 E 4th Ave
- 945 Saint Clair Ave
- 945 St Clair Ave
- 949 Saint Clair Ave Unit 951
- 861 Gibbard Ave Unit 863
- 941 St Clair Ave
- 865 E 4th Ave
- 959 Saint Clair Ave
- 899 Gibbard Ave