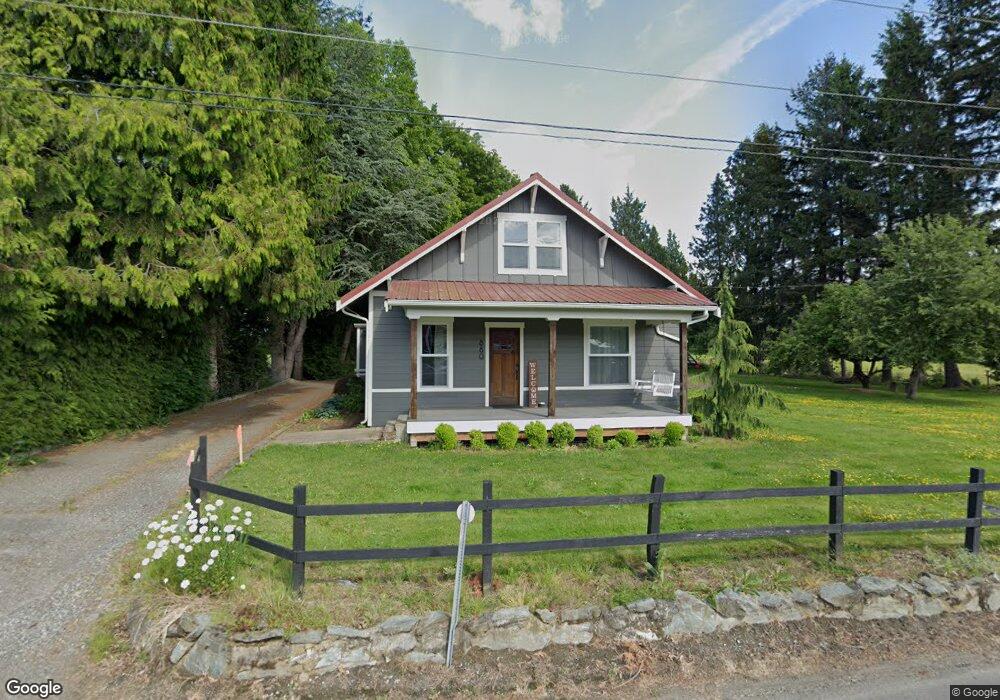
880 Hampton Rd Lynden, WA 98264
Estimated Value: $682,000 - $857,317
4
Beds
2
Baths
1,687
Sq Ft
$456/Sq Ft
Est. Value
About This Home
This home is located at 880 Hampton Rd, Lynden, WA 98264 and is currently estimated at $769,659, approximately $456 per square foot. 880 Hampton Rd is a home located in Whatcom County with nearby schools including Lynden High School, Lynden Christian School, and Lynden Christian Schools: Administration.
Ownership History
Date
Name
Owned For
Owner Type
Purchase Details
Closed on
Jul 17, 2005
Sold by
Brennick Layne and Brennick Lori
Bought by
Hastings Gary and Hastings Kalise
Current Estimated Value
Home Financials for this Owner
Home Financials are based on the most recent Mortgage that was taken out on this home.
Original Mortgage
$251,250
Outstanding Balance
$130,222
Interest Rate
5.55%
Mortgage Type
Fannie Mae Freddie Mac
Estimated Equity
$639,437
Purchase Details
Closed on
May 12, 2000
Sold by
Schipper Henk and Schipper Helena A
Bought by
Brennick Layne and Brennick Lori
Home Financials for this Owner
Home Financials are based on the most recent Mortgage that was taken out on this home.
Original Mortgage
$135,000
Interest Rate
8.22%
Create a Home Valuation Report for This Property
The Home Valuation Report is an in-depth analysis detailing your home's value as well as a comparison with similar homes in the area
Home Values in the Area
Average Home Value in this Area
Purchase History
| Date | Buyer | Sale Price | Title Company |
|---|---|---|---|
| Hastings Gary | $335,280 | Chicago Title Insurance | |
| Brennick Layne | $158,000 | Whatcom Land Title |
Source: Public Records
Mortgage History
| Date | Status | Borrower | Loan Amount |
|---|---|---|---|
| Open | Hastings Gary | $251,250 | |
| Previous Owner | Brennick Layne | $135,000 |
Source: Public Records
Tax History Compared to Growth
Tax History
| Year | Tax Paid | Tax Assessment Tax Assessment Total Assessment is a certain percentage of the fair market value that is determined by local assessors to be the total taxable value of land and additions on the property. | Land | Improvement |
|---|---|---|---|---|
| 2024 | $5,795 | $840,493 | $395,953 | $444,540 |
| 2023 | $5,795 | $835,642 | $408,199 | $427,443 |
| 2022 | $3,855 | $663,603 | $243,375 | $420,228 |
| 2021 | $3,737 | $526,668 | $193,154 | $333,514 |
| 2020 | $3,227 | $330,812 | $35,670 | $295,142 |
| 2019 | $2,885 | $410,640 | $150,601 | $260,039 |
| 2018 | $3,103 | $261,997 | $28,250 | $233,747 |
| 2017 | $2,853 | $231,856 | $25,000 | $206,856 |
| 2016 | $2,870 | $226,057 | $22,640 | $203,417 |
| 2015 | $2,569 | $226,057 | $22,640 | $203,417 |
| 2014 | -- | $229,820 | $31,974 | $197,846 |
| 2013 | -- | $208,869 | $29,172 | $179,697 |
Source: Public Records
Map
Nearby Homes
- 400 E Front St
- 924 E Grover St
- 215 Skipping Stone Loop
- 214 Skipping Stone Loop
- 220 Skipping Stone Loop
- 208 Skipping Stone Loop
- 1077 Hampton Rd
- 204 Skipping Stone Loop
- 231 Skipping Stone Loop
- 1095 Terrace Dr
- 202 Skipping Stone Loop
- 205 Riverwalk Dr
- 208 Riverwalk Dr
- 205 Pebblebrook Dr
- 211 Pebblebrook Dr
- 207 Pebblebrook Dr
- 204 Pebblebrook Dr
- 102 Riverwalk Dr
- 206 Pebblebrook Dr
- 104 Riverwalk Dr