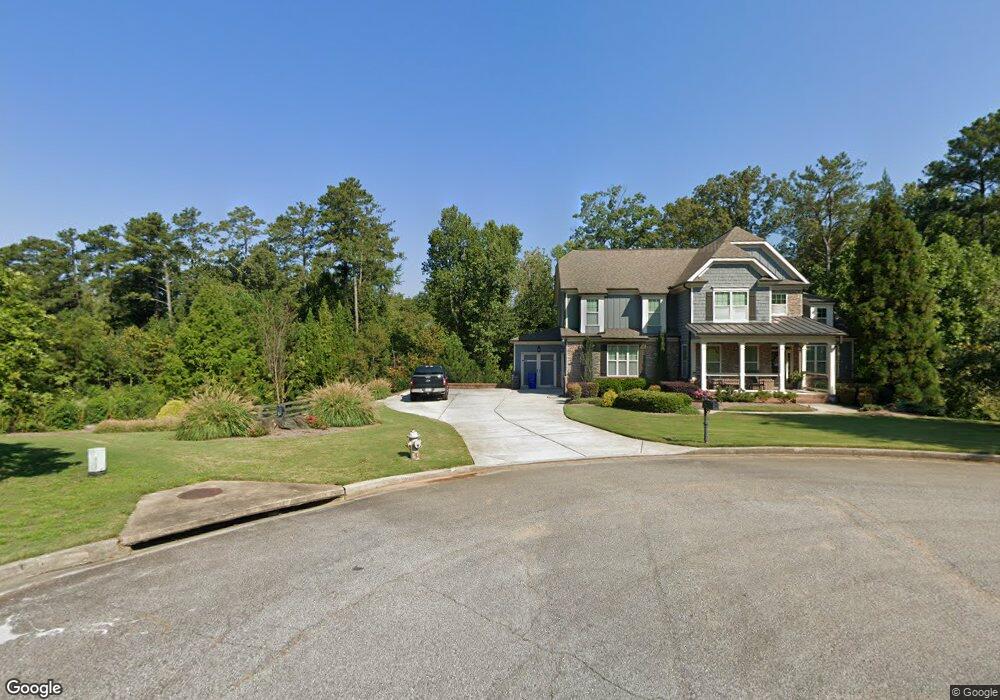
880 Hickory Shoals Rd NW Marietta, GA 30064
West Cobb NeighborhoodEstimated Value: $682,000 - $843,000
4
Beds
4
Baths
3,201
Sq Ft
$243/Sq Ft
Est. Value
About This Home
This home is located at 880 Hickory Shoals Rd NW, Marietta, GA 30064 and is currently estimated at $777,080, approximately $242 per square foot. 880 Hickory Shoals Rd NW is a home with nearby schools including Due West Elementary School, Lost Mountain Middle School, and Harrison High School.
Ownership History
Date
Name
Owned For
Owner Type
Purchase Details
Closed on
Jun 4, 2015
Sold by
Thompson Adam C
Bought by
Lipani Michael J and Lipani Emily D
Current Estimated Value
Home Financials for this Owner
Home Financials are based on the most recent Mortgage that was taken out on this home.
Original Mortgage
$417,000
Outstanding Balance
$323,556
Interest Rate
3.88%
Mortgage Type
New Conventional
Estimated Equity
$453,524
Purchase Details
Closed on
Feb 16, 2012
Sold by
Acadia Homes Neighborhoo
Bought by
Thompson Adam C and Thompson Jill S
Home Financials for this Owner
Home Financials are based on the most recent Mortgage that was taken out on this home.
Original Mortgage
$416,750
Interest Rate
3.89%
Mortgage Type
VA
Purchase Details
Closed on
Nov 6, 2007
Sold by
Nesbitt Lord & Co
Bought by
First Security Natl Bk
Create a Home Valuation Report for This Property
The Home Valuation Report is an in-depth analysis detailing your home's value as well as a comparison with similar homes in the area
Home Values in the Area
Average Home Value in this Area
Purchase History
| Date | Buyer | Sale Price | Title Company |
|---|---|---|---|
| Lipani Michael J | $445,000 | -- | |
| Thompson Adam C | $403,452 | -- | |
| First Security Natl Bk | $153,000 | -- |
Source: Public Records
Mortgage History
| Date | Status | Borrower | Loan Amount |
|---|---|---|---|
| Open | Lipani Michael J | $417,000 | |
| Previous Owner | Thompson Adam C | $416,750 |
Source: Public Records
Tax History Compared to Growth
Tax History
| Year | Tax Paid | Tax Assessment Tax Assessment Total Assessment is a certain percentage of the fair market value that is determined by local assessors to be the total taxable value of land and additions on the property. | Land | Improvement |
|---|---|---|---|---|
| 2025 | $6,792 | $270,056 | $40,000 | $230,056 |
| 2024 | $6,797 | $270,056 | $40,000 | $230,056 |
| 2023 | $6,254 | $270,056 | $40,000 | $230,056 |
| 2022 | $6,927 | $273,608 | $40,000 | $233,608 |
| 2021 | $6,123 | $236,876 | $40,000 | $196,876 |
| 2020 | $5,097 | $190,000 | $40,000 | $150,000 |
| 2019 | $5,782 | $221,292 | $40,000 | $181,292 |
| 2018 | $4,762 | $174,696 | $40,000 | $134,696 |
| 2017 | $4,553 | $174,696 | $40,000 | $134,696 |
| 2016 | $4,557 | $174,696 | $40,000 | $134,696 |
| 2015 | $4,217 | $143,148 | $20,000 | $123,148 |
| 2014 | $4,253 | $143,148 | $0 | $0 |
Source: Public Records
Map
Nearby Homes
- 1034 W Mill Dr NW Unit 1
- 975 W Mill Bend NW
- 978 W Mill Bend NW
- 1015 Token Way NW
- 4219 W Mill Trail NW
- 4203 W Mill Trail NW
- 4120 Chanticleer Dr NW
- 1231 Fawndale Dr NW
- 4362 Rolling Oaks Ct NW
- 0 W Pointe Dr NW Unit 10457092
- 0 W Pointe Dr NW Unit 7522802
- 511 Earlvine Way NW
- 4100 Chanticleer Dr NW
- 3816 Whithorn Way
- 4220 Rockpoint Dr NW
- 4421 Wooded Oaks NW
- 355 Glynnwilde Dr NW
- 870 Hickory Shoals Rd NW
- 865 Hickory Shoals Rd NW
- 860 Hickory Shoals Rd NW
- 850 Hickory Shoals Rd NW
- 845 Hickory Shoals Rd NW
- 1141 W Mill Dr NW Unit 1
- 840 Hickory Shoals Rd NW
- 1026 W Mill Dr NW
- 1026 W Mill Dr NW Unit 1
- 1036 Peace Dr NW Unit 1
- 825 Hickory Shoals Rd NW
- 1024 W Mill Dr NW
- 1024 W Mill Dr NW
- 1034 Peace Dr NW Unit 1
- 830 Hickory Shoals Rd NW
- 1028 W Mill Dr NW
- 1030 Bud Ct NW
- 0 Hickory Shoals Rd NW Unit 8372697
- 0 Hickory Shoals Rd NW Unit 8210351
- 0 Hickory Shoals Rd NW Unit 8131784