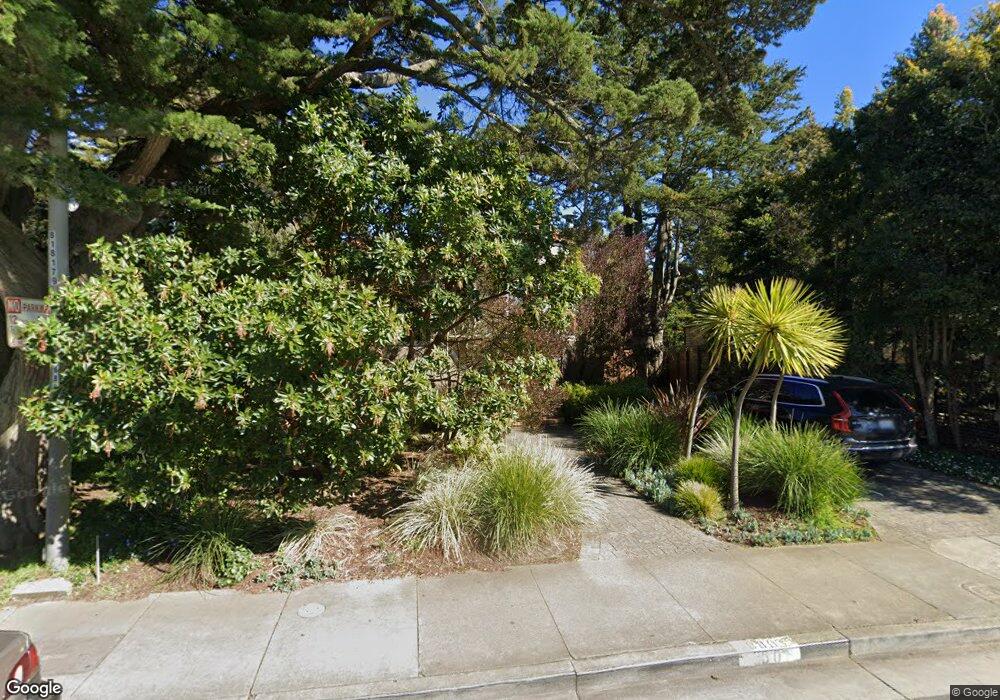
880 Urbano Dr San Francisco, CA 94127
Ingleside Terrace NeighborhoodEstimated Value: $1,874,154 - $2,259,000
3
Beds
2
Baths
2,080
Sq Ft
$982/Sq Ft
Est. Value
About This Home
This home is located at 880 Urbano Dr, San Francisco, CA 94127 and is currently estimated at $2,043,289, approximately $982 per square foot. 880 Urbano Dr is a home located in San Francisco County with nearby schools including Commodore Sloat Elementary School, Aptos Middle School, and St. Stephen School.
Ownership History
Date
Name
Owned For
Owner Type
Purchase Details
Closed on
May 26, 2011
Sold by
Desroches David Paul and Desroches Rebecca Lloyd
Bought by
Casis Rene P and Hayward Jennifer R
Current Estimated Value
Home Financials for this Owner
Home Financials are based on the most recent Mortgage that was taken out on this home.
Original Mortgage
$75,000
Outstanding Balance
$28,882
Interest Rate
4.55%
Mortgage Type
Stand Alone Second
Estimated Equity
$2,014,407
Purchase Details
Closed on
Oct 4, 2001
Sold by
Desroches David Paul and Desroches Rebecca Lloyd
Bought by
Desroches David Paul and Desroches Rebecca Lloyd
Purchase Details
Closed on
Oct 26, 1999
Sold by
Te Wu Chien
Bought by
Desroches David P and Desroches Rebecca L
Home Financials for this Owner
Home Financials are based on the most recent Mortgage that was taken out on this home.
Original Mortgage
$400,000
Interest Rate
7.37%
Create a Home Valuation Report for This Property
The Home Valuation Report is an in-depth analysis detailing your home's value as well as a comparison with similar homes in the area
Home Values in the Area
Average Home Value in this Area
Purchase History
| Date | Buyer | Sale Price | Title Company |
|---|---|---|---|
| Casis Rene P | $1,005,000 | Old Republic Title Company | |
| Desroches David Paul | -- | -- | |
| Desroches David P | $600,000 | Commonwealth Land Title Co |
Source: Public Records
Mortgage History
| Date | Status | Borrower | Loan Amount |
|---|---|---|---|
| Open | Casis Rene P | $75,000 | |
| Open | Casis Rene P | $729,000 | |
| Previous Owner | Desroches David P | $400,000 |
Source: Public Records
Tax History Compared to Growth
Tax History
| Year | Tax Paid | Tax Assessment Tax Assessment Total Assessment is a certain percentage of the fair market value that is determined by local assessors to be the total taxable value of land and additions on the property. | Land | Improvement |
|---|---|---|---|---|
| 2025 | $15,495 | $1,287,571 | $901,302 | $386,269 |
| 2024 | $15,495 | $1,262,326 | $883,630 | $378,696 |
| 2023 | $15,258 | $1,237,575 | $866,304 | $371,271 |
| 2022 | $14,964 | $1,213,310 | $849,318 | $363,992 |
| 2021 | $14,697 | $1,189,520 | $832,665 | $356,855 |
| 2020 | $14,766 | $1,177,324 | $824,128 | $353,196 |
| 2019 | $14,259 | $1,154,240 | $807,969 | $346,271 |
| 2018 | $13,778 | $1,131,609 | $792,127 | $339,482 |
| 2017 | $13,316 | $1,109,422 | $776,596 | $332,826 |
| 2016 | $13,095 | $1,087,669 | $761,369 | $326,300 |
| 2015 | $12,932 | $1,071,332 | $749,933 | $321,399 |
| 2014 | $12,590 | $1,050,347 | $735,243 | $315,104 |
Source: Public Records
Map
Nearby Homes
- 337 Jules Ave
- 275 Miramar Ave
- 271 Granada Ave
- 2 Westgate Dr
- 55 Upland Dr
- 185 Upland Dr
- 424 Garfield St
- 14 Southwood Dr
- 150 Upland Dr
- 442 Bright St
- 324 Holloway Ave
- 611 Miramar Ave
- 850 Darien Way
- 54 Eastwood Dr
- 52-54 Eastwood Dr
- 451 Ramsell St
- 224 Shields St
- 914 Capitol Ave
- 760 Darien Way
- 245 Westgate Dr