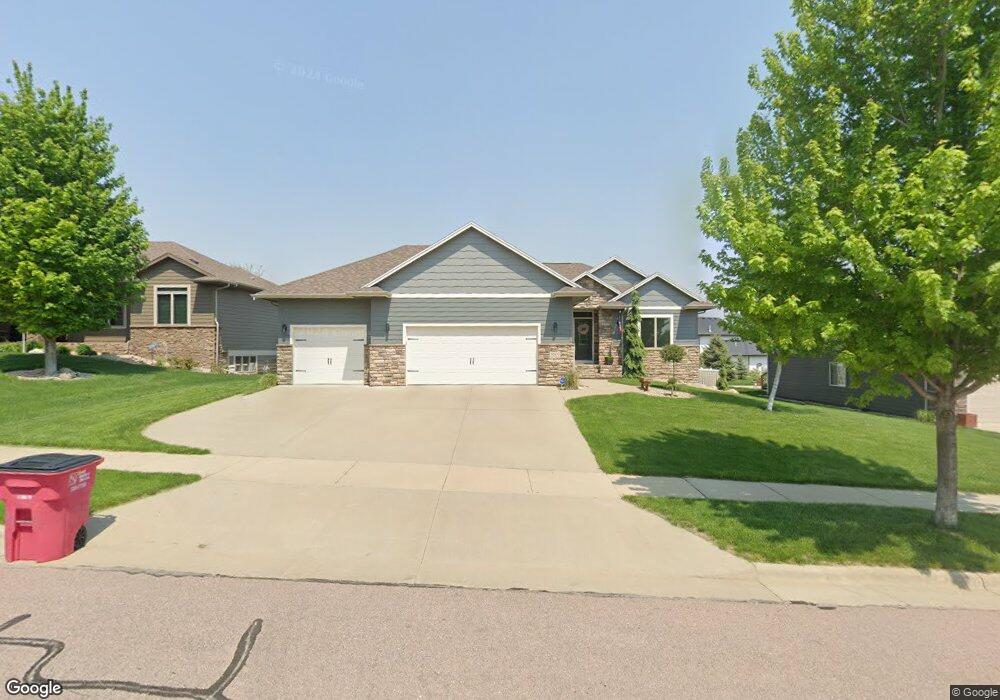
8800 E Palametto St Sioux Falls, SD 57110
Northeast Sioux Falls NeighborhoodEstimated Value: $682,000 - $785,000
5
Beds
3
Baths
3,333
Sq Ft
$214/Sq Ft
Est. Value
About This Home
This home is located at 8800 E Palametto St, Sioux Falls, SD 57110 and is currently estimated at $712,883, approximately $213 per square foot. 8800 E Palametto St is a home located in Minnehaha County with nearby schools including Fred Assam Elementary School, Brandon Valley Intermediate School, and Brandon Valley Middle School.
Ownership History
Date
Name
Owned For
Owner Type
Purchase Details
Closed on
May 24, 2021
Sold by
Horazdovsky Kyle and Horazdovsky Celeste
Bought by
Ticknor Andrew J and Ticknor Tara R
Current Estimated Value
Purchase Details
Closed on
Apr 1, 2020
Sold by
Wang Heeyoung P and Wang Melissa
Bought by
Horazdovsky Kyle and Horazdovsky Celeste
Home Financials for this Owner
Home Financials are based on the most recent Mortgage that was taken out on this home.
Original Mortgage
$382,500
Interest Rate
3.4%
Mortgage Type
New Conventional
Purchase Details
Closed on
May 29, 2014
Bought by
Wang Heeyoung P and Wang Melissa
Home Financials for this Owner
Home Financials are based on the most recent Mortgage that was taken out on this home.
Original Mortgage
$373,255
Interest Rate
4.28%
Mortgage Type
New Conventional
Create a Home Valuation Report for This Property
The Home Valuation Report is an in-depth analysis detailing your home's value as well as a comparison with similar homes in the area
Home Values in the Area
Average Home Value in this Area
Purchase History
| Date | Buyer | Sale Price | Title Company |
|---|---|---|---|
| Ticknor Andrew J | $525,000 | Stewart Title Company | |
| Horazdovsky Kyle | $510,000 | Stewart Title Company | |
| Wang Heeyoung P | $392,900 | Getty Abstract & Title Comp |
Source: Public Records
Mortgage History
| Date | Status | Borrower | Loan Amount |
|---|---|---|---|
| Previous Owner | Horazdovsky Kyle | $382,500 | |
| Previous Owner | Wang Heeyoung P | $373,255 |
Source: Public Records
Tax History
| Year | Tax Paid | Tax Assessment Tax Assessment Total Assessment is a certain percentage of the fair market value that is determined by local assessors to be the total taxable value of land and additions on the property. | Land | Improvement |
|---|---|---|---|---|
| 2024 | $7,874 | $583,700 | $74,700 | $509,000 |
| 2023 | $7,631 | $538,900 | $74,800 | $464,100 |
| 2022 | $7,403 | $495,200 | $74,800 | $420,400 |
| 2021 | $6,923 | $443,900 | $0 | $0 |
| 2020 | $6,923 | $429,500 | $0 | $0 |
| 2019 | $6,798 | $414,095 | $0 | $0 |
| 2018 | $6,676 | $404,777 | $0 | $0 |
| 2017 | $6,586 | $401,671 | $60,000 | $341,671 |
| 2016 | $6,586 | $389,247 | $60,000 | $329,247 |
| 2015 | $6,497 | $365,056 | $60,000 | $305,056 |
| 2014 | $6,378 | $365,056 | $60,000 | $305,056 |
Source: Public Records
Map
Nearby Homes
- 8808 E Silverbell St
- 607 S Torrey Pine Ln
- 9004 E Black Walnut Cir
- 505 S Sassafras Cir
- 8501 E Torchwood Place
- 9005 E Torrey Pine Cir Cir
- 8601 E Torchwood Place
- 8701 E Torchwood Ln
- 0 Lt03-Bk07 E Everest Cir
- 0 Lt04-Bk07 E Everest Cir
- 0 Lt05-Bk07 E Everest Cir
- 0 Lt06-Bk07 E Everest Cir
- 0 Lt02-Bk07 E Everest Cir
- 0 Lt07-Bk07 N Sanctuary Dr
- 0 Lt07-Bk08 E Sumac Cir
- 0 Lt01-Bk07 E Everest Cir
- 0 Lt08-Bk08 E Sumac Cir
- 0 Lot 6 Block 8 Sumac Cir Cir Unit 22507420
- 0 Lt09-Bk05 E Moonlight Cir
- 0 Lt09-Bk08 E Sumac Cir
- 8800 E Palametto St St
- 8708 E Palametto St
- 8708 E Palametto St St
- 8804 E Palametto St
- 8804 E Palametto St St
- 8704 E Palametto St
- 8704 E Palametto St St
- 8805 E Silverbell St
- 8801 E Palametto St
- 8801 E Palametto St St
- 8713 E Palametto St
- 8713 E Palametto St St
- 8808 E Palametto St
- 8805 E Palametto St
- 8805 E Palametto St St
- 8809 E Silverbell St
- 8801 E Silverbelle St
- 8801 E Silverbell St
- 0 E Palametto St Unit 21412438
- 0 E Palametto St Unit 21412437
Your Personal Tour Guide
Ask me questions while you tour the home.