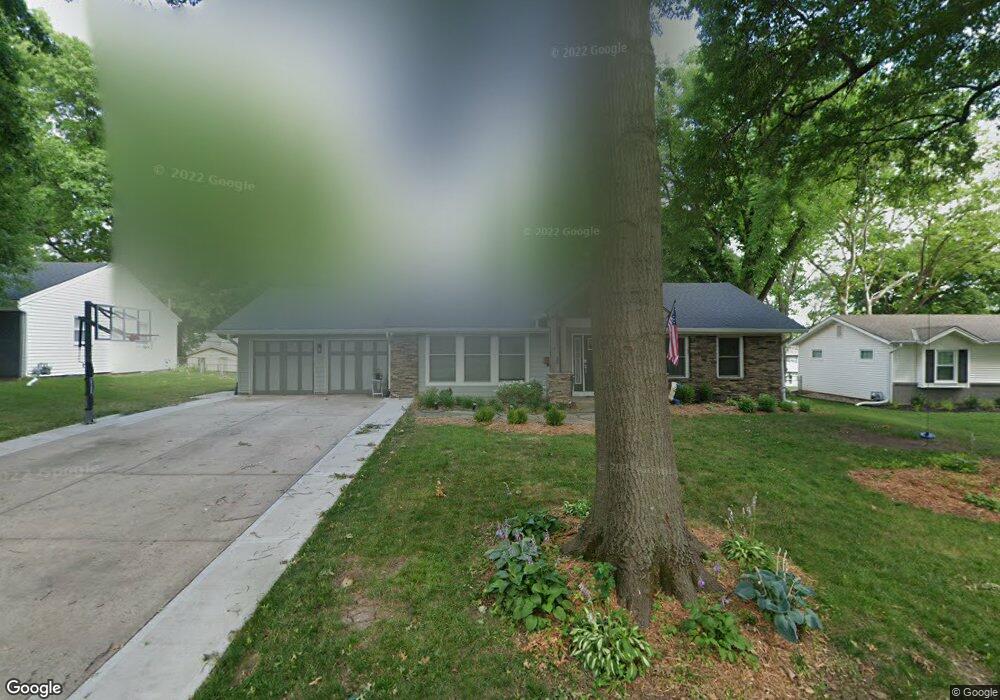
8801 Maple Dr Overland Park, KS 66207
Estimated Value: $397,000 - $429,567
3
Beds
2
Baths
1,472
Sq Ft
$281/Sq Ft
Est. Value
About This Home
This home is located at 8801 Maple Dr, Overland Park, KS 66207 and is currently estimated at $413,392, approximately $280 per square foot. 8801 Maple Dr is a home located in Johnson County with nearby schools including Briarwood Elementary School, Indian Hills Middle School, and Shawnee Mission East High School.
Ownership History
Date
Name
Owned For
Owner Type
Purchase Details
Closed on
Jun 30, 2022
Sold by
Strand and Christina
Bought by
Patrick And Christina Strand Joint Revocable
Current Estimated Value
Home Financials for this Owner
Home Financials are based on the most recent Mortgage that was taken out on this home.
Original Mortgage
$150,000
Outstanding Balance
$142,708
Interest Rate
5.09%
Mortgage Type
Credit Line Revolving
Estimated Equity
$270,684
Purchase Details
Closed on
Apr 1, 2019
Sold by
Strand Christina Kollasch
Bought by
Patrick & Christina Strand Joint Rev Tr
Purchase Details
Closed on
Dec 6, 2011
Sold by
Hopkins Pamela J
Bought by
Strand Christina Kollasch
Home Financials for this Owner
Home Financials are based on the most recent Mortgage that was taken out on this home.
Original Mortgage
$151,070
Interest Rate
3.75%
Mortgage Type
FHA
Create a Home Valuation Report for This Property
The Home Valuation Report is an in-depth analysis detailing your home's value as well as a comparison with similar homes in the area
Home Values in the Area
Average Home Value in this Area
Purchase History
| Date | Buyer | Sale Price | Title Company |
|---|---|---|---|
| Patrick And Christina Strand Joint Revocable | -- | Security 1St Title | |
| Strand Patrick | -- | Security 1St Title | |
| Patrick & Christina Strand Joint Rev Tr | -- | None Available | |
| Strand Christina Kollasch | -- | Continental Title |
Source: Public Records
Mortgage History
| Date | Status | Borrower | Loan Amount |
|---|---|---|---|
| Open | Strand Patrick | $150,000 | |
| Previous Owner | Strand Christina Kollasch | $151,070 |
Source: Public Records
Tax History Compared to Growth
Tax History
| Year | Tax Paid | Tax Assessment Tax Assessment Total Assessment is a certain percentage of the fair market value that is determined by local assessors to be the total taxable value of land and additions on the property. | Land | Improvement |
|---|---|---|---|---|
| 2024 | $3,985 | $41,320 | $9,988 | $31,332 |
| 2023 | $3,818 | $39,020 | $9,988 | $29,032 |
| 2022 | $3,585 | $36,892 | $9,988 | $26,904 |
| 2021 | $2,903 | $28,440 | $8,691 | $19,749 |
| 2020 | $2,794 | $27,405 | $6,946 | $20,459 |
| 2019 | $2,536 | $24,909 | $5,346 | $19,563 |
| 2018 | $2,294 | $22,448 | $5,346 | $17,102 |
| 2017 | $2,098 | $20,217 | $5,346 | $14,871 |
| 2016 | $2,014 | $19,090 | $5,346 | $13,744 |
| 2015 | $1,847 | $17,894 | $5,346 | $12,548 |
| 2013 | -- | $18,170 | $5,346 | $12,824 |
Source: Public Records
Map
Nearby Homes
- 5516 W 87th Terrace
- 8818 Birch Ln
- 8932 Nall Ave
- 9015 Outlook Dr
- 4969 W 88th St
- 5615 W 91st St
- 5482 W 85th Terrace
- 6201 W 86th Terrace
- 9100 Dearborn St
- 6108 W 85th Terrace
- 6116 W 85th Terrace
- 8326 Maple Ln
- 8331 Beverly Dr
- 9234 Woodson Dr
- 9111 Walmer St
- 9307 Woodson Dr
- 8252 Outlook Ln
- 5506 W 82nd Terrace
- 5300 W 101st Terrace
- 6725 W 85th Terrace