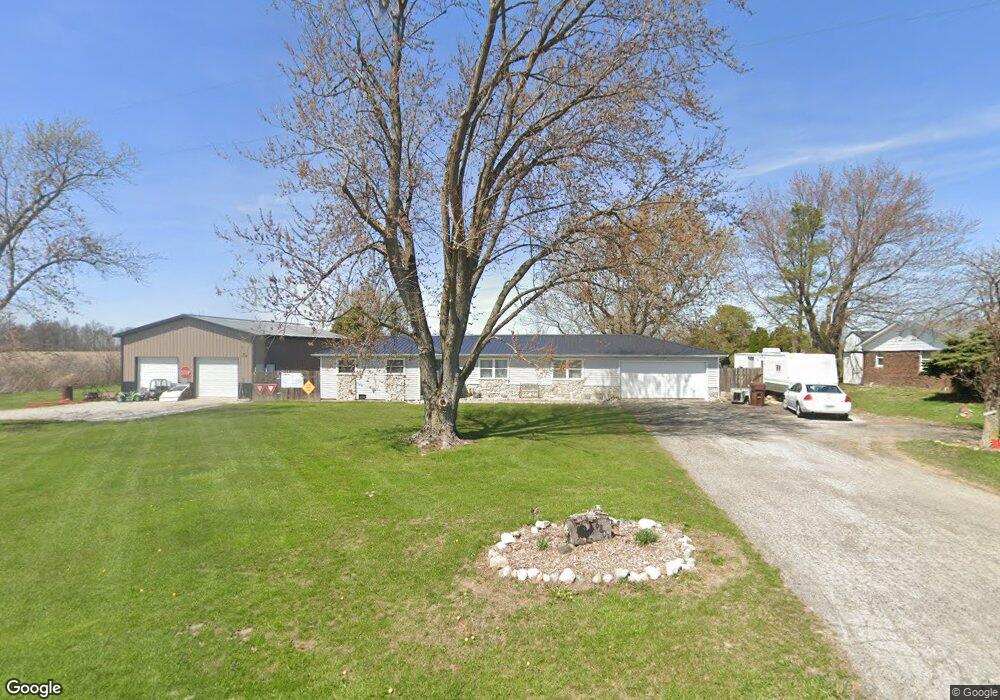
8803 E 200 N Marion, IN 46952
Estimated Value: $158,000 - $203,000
3
Beds
2
Baths
1,508
Sq Ft
$122/Sq Ft
Est. Value
About This Home
This home is located at 8803 E 200 N, Marion, IN 46952 and is currently estimated at $184,706, approximately $122 per square foot. 8803 E 200 N is a home located in Grant County.
Ownership History
Date
Name
Owned For
Owner Type
Purchase Details
Closed on
Mar 19, 2020
Sold by
King David L and King Renae D
Bought by
Bowser Jessica L
Current Estimated Value
Home Financials for this Owner
Home Financials are based on the most recent Mortgage that was taken out on this home.
Original Mortgage
$36,000
Outstanding Balance
$31,473
Interest Rate
3.4%
Mortgage Type
New Conventional
Estimated Equity
$153,233
Purchase Details
Closed on
Jul 23, 2010
Sold by
King David L and Williams Renae
Bought by
King David L and Renae King D
Create a Home Valuation Report for This Property
The Home Valuation Report is an in-depth analysis detailing your home's value as well as a comparison with similar homes in the area
Purchase History
| Date | Buyer | Sale Price | Title Company |
|---|---|---|---|
| Bowser Jessica L | -- | None Available | |
| King David L | -- | None Available |
Source: Public Records
Mortgage History
| Date | Status | Borrower | Loan Amount |
|---|---|---|---|
| Open | Bowser Jessica L | $36,000 |
Source: Public Records
Tax History
| Year | Tax Paid | Tax Assessment Tax Assessment Total Assessment is a certain percentage of the fair market value that is determined by local assessors to be the total taxable value of land and additions on the property. | Land | Improvement |
|---|---|---|---|---|
| 2025 | $645 | $137,100 | $27,600 | $109,500 |
| 2024 | $645 | $129,100 | $27,600 | $101,500 |
| 2023 | $771 | $127,200 | $27,600 | $99,600 |
| 2022 | $471 | $102,300 | $17,700 | $84,600 |
| 2021 | $1,265 | $95,000 | $17,700 | $77,300 |
| 2020 | $1,211 | $99,400 | $17,700 | $81,700 |
| 2019 | $444 | $99,400 | $17,700 | $81,700 |
| 2018 | $365 | $99,400 | $17,700 | $81,700 |
| 2017 | $340 | $99,400 | $17,700 | $81,700 |
| 2016 | $321 | $99,400 | $17,700 | $81,700 |
| 2014 | $287 | $95,100 | $17,500 | $77,600 |
| 2013 | $287 | $93,300 | $17,500 | $75,800 |
Source: Public Records
Map
Nearby Homes
Your Personal Tour Guide
Ask me questions while you tour the home.