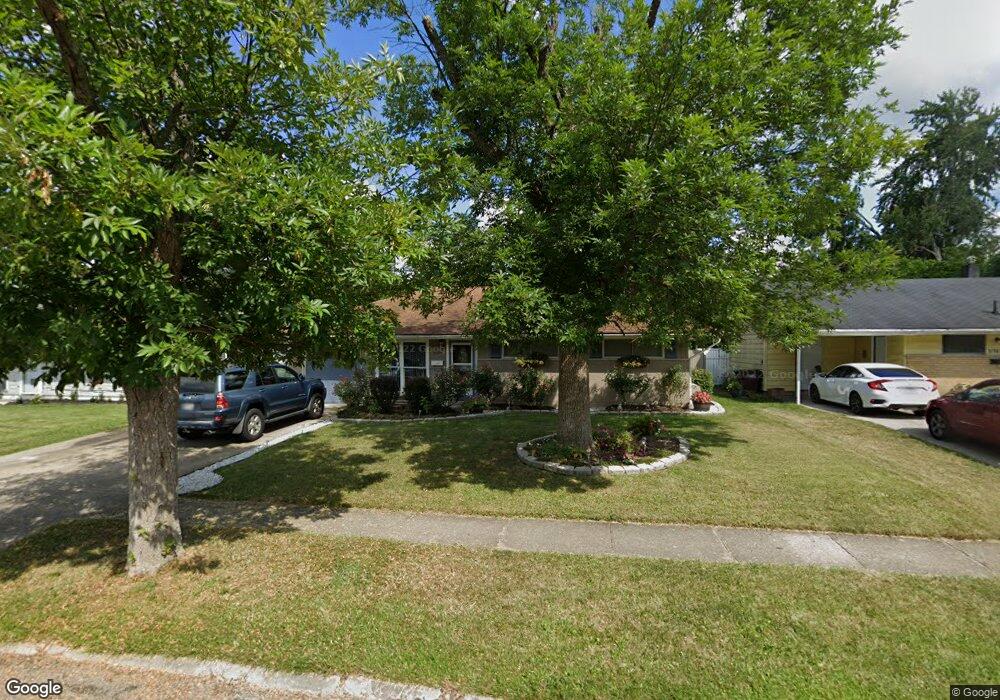
8804 Balboa Dr Cincinnati, OH 45231
Finneytown NeighborhoodEstimated Value: $106,000 - $155,000
3
Beds
1
Bath
1,128
Sq Ft
$120/Sq Ft
Est. Value
About This Home
This home is located at 8804 Balboa Dr, Cincinnati, OH 45231 and is currently estimated at $135,738, approximately $120 per square foot. 8804 Balboa Dr is a home located in Hamilton County with nearby schools including Mt Healthy High School, St. Vivian School, and John Paul II Catholic School.
Ownership History
Date
Name
Owned For
Owner Type
Purchase Details
Closed on
Dec 18, 2009
Sold by
Terry Charles L and Terry Leslie
Bought by
Terry Charles L and Terry Leslie
Current Estimated Value
Purchase Details
Closed on
Jan 30, 1997
Sold by
Brown Moses L and Brown Barbara
Bought by
Terry Charles L
Home Financials for this Owner
Home Financials are based on the most recent Mortgage that was taken out on this home.
Original Mortgage
$56,470
Outstanding Balance
$5,107
Interest Rate
7.92%
Mortgage Type
FHA
Estimated Equity
$130,631
Create a Home Valuation Report for This Property
The Home Valuation Report is an in-depth analysis detailing your home's value as well as a comparison with similar homes in the area
Home Values in the Area
Average Home Value in this Area
Purchase History
| Date | Buyer | Sale Price | Title Company |
|---|---|---|---|
| Terry Charles L | -- | Attorney | |
| Terry Charles L | $56,500 | -- |
Source: Public Records
Mortgage History
| Date | Status | Borrower | Loan Amount |
|---|---|---|---|
| Open | Terry Charles L | $56,470 |
Source: Public Records
Tax History
| Year | Tax Paid | Tax Assessment Tax Assessment Total Assessment is a certain percentage of the fair market value that is determined by local assessors to be the total taxable value of land and additions on the property. | Land | Improvement |
|---|---|---|---|---|
| 2025 | $1,918 | $32,831 | $4,757 | $28,074 |
| 2023 | $1,806 | $32,831 | $4,757 | $28,074 |
| 2022 | $1,126 | $14,672 | $4,711 | $9,961 |
| 2021 | $1,096 | $14,672 | $4,711 | $9,961 |
| 2020 | $1,112 | $14,672 | $4,711 | $9,961 |
| 2019 | $1,101 | $13,584 | $4,361 | $9,223 |
| 2018 | $1,107 | $13,584 | $4,361 | $9,223 |
| 2017 | $1,051 | $13,584 | $4,361 | $9,223 |
| 2016 | $1,403 | $17,938 | $4,708 | $13,230 |
| 2015 | $1,414 | $17,938 | $4,708 | $13,230 |
| 2014 | $1,408 | $17,938 | $4,708 | $13,230 |
| 2013 | $1,451 | $18,883 | $4,956 | $13,927 |
Source: Public Records
Map
Nearby Homes
- 8754 Monsanto Dr
- 1116 Madeleine Cir
- 8943 Monsanto Dr
- 1297 Landis Ln
- 1144 Hempstead Dr
- 8719 Hood Ct
- 8771 Desoto Dr
- 1101 Meadowind Ct
- 7352 Clovernook Ave
- 8628 Mockingbird Ln
- 8829 Mockingbird Ln
- 1055 Hempstead Dr
- 1123 Compton Rd
- 1088 Pinehollow Ln
- 7227 Bernard Ave
- 1115 Compton Rd
- 1458 Van Fleet Ave
- 8491 Daly Rd
- 1478 Foxwood Dr
- 1481 Saint Clair Ave
Your Personal Tour Guide
Ask me questions while you tour the home.