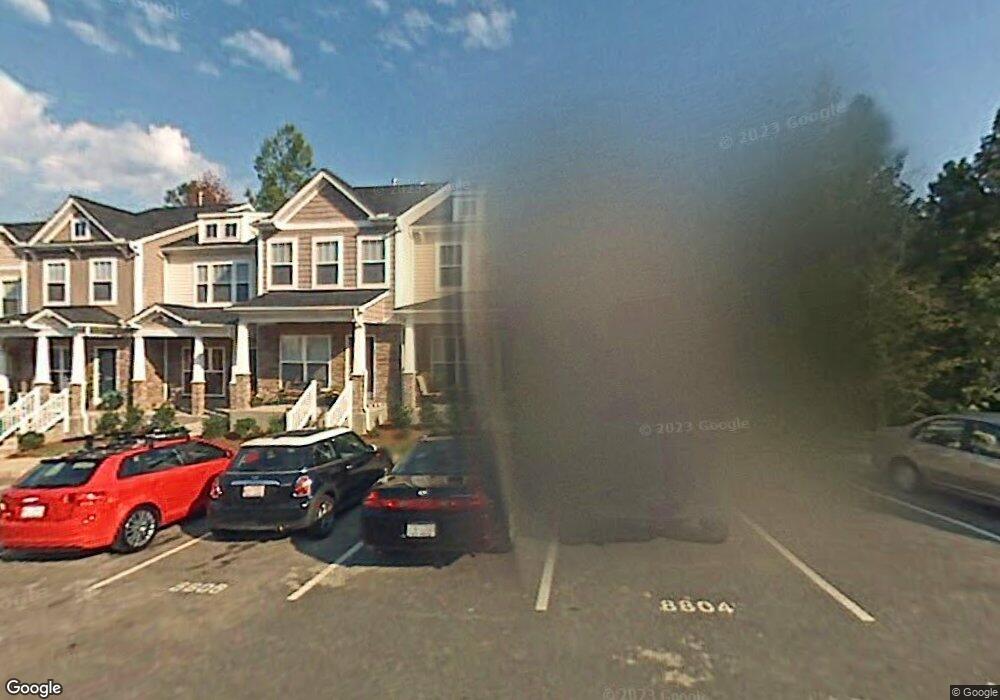
8804 Orchard Grove Way Raleigh, NC 27612
Umstead NeighborhoodEstimated Value: $343,946 - $356,000
2
Beds
4
Baths
1,813
Sq Ft
$194/Sq Ft
Est. Value
About This Home
This home is located at 8804 Orchard Grove Way, Raleigh, NC 27612 and is currently estimated at $351,737, approximately $194 per square foot. 8804 Orchard Grove Way is a home located in Wake County with nearby schools including Leesville Road Elementary School, Leesville Road Middle School, and Leesville Road High School.
Ownership History
Date
Name
Owned For
Owner Type
Purchase Details
Closed on
Feb 11, 2019
Sold by
Dumbleton Joshua D
Bought by
Goodyear Nancy Nelson
Current Estimated Value
Purchase Details
Closed on
Dec 16, 2015
Sold by
Wilborne Ryan S and Wilborne Catherine B
Bought by
Dumbleton Joshua D
Home Financials for this Owner
Home Financials are based on the most recent Mortgage that was taken out on this home.
Original Mortgage
$177,600
Interest Rate
3.91%
Mortgage Type
New Conventional
Purchase Details
Closed on
Dec 28, 2006
Sold by
Beazer Homes Corp
Bought by
Wilborne Ryan S and Wilborne Catherine B
Home Financials for this Owner
Home Financials are based on the most recent Mortgage that was taken out on this home.
Original Mortgage
$158,424
Interest Rate
6.19%
Mortgage Type
Unknown
Purchase Details
Closed on
Jul 5, 2006
Sold by
Ebenezer Church Road Llc
Bought by
Beazer Homes Corp
Create a Home Valuation Report for This Property
The Home Valuation Report is an in-depth analysis detailing your home's value as well as a comparison with similar homes in the area
Home Values in the Area
Average Home Value in this Area
Purchase History
| Date | Buyer | Sale Price | Title Company |
|---|---|---|---|
| Goodyear Nancy Nelson | $230,000 | None Available | |
| Dumbleton Joshua D | $187,000 | None Available | |
| Wilborne Ryan S | $198,500 | None Available | |
| Beazer Homes Corp | $710,000 | None Available |
Source: Public Records
Mortgage History
| Date | Status | Borrower | Loan Amount |
|---|---|---|---|
| Previous Owner | Dumbleton Joshua D | $177,600 | |
| Previous Owner | Wilborne Ryan S | $158,424 |
Source: Public Records
Tax History Compared to Growth
Tax History
| Year | Tax Paid | Tax Assessment Tax Assessment Total Assessment is a certain percentage of the fair market value that is determined by local assessors to be the total taxable value of land and additions on the property. | Land | Improvement |
|---|---|---|---|---|
| 2025 | $971 | $349,802 | $90,000 | $259,802 |
| 2024 | $1,918 | $349,802 | $90,000 | $259,802 |
| 2023 | $2,539 | $231,126 | $45,000 | $186,126 |
| 2022 | $2,360 | $231,126 | $45,000 | $186,126 |
| 2021 | $2,269 | $231,126 | $45,000 | $186,126 |
| 2020 | $2,228 | $231,126 | $45,000 | $186,126 |
| 2019 | $1,811 | $184,726 | $40,000 | $144,726 |
| 2018 | $2,038 | $184,726 | $40,000 | $144,726 |
| 2017 | $1,942 | $184,726 | $40,000 | $144,726 |
| 2016 | $1,902 | $184,726 | $40,000 | $144,726 |
| 2015 | $1,983 | $189,613 | $39,000 | $150,613 |
| 2014 | $1,882 | $189,613 | $39,000 | $150,613 |
Source: Public Records
Map
Nearby Homes
- 8823 Orchard Grove Way
- 8025 Goldenrain Way
- 8741 Cypress Grove
- 8719 Cypress Grove Run
- 8016 Sycamore Hill Ln
- 8032 Sycamore Hill Ln
- 8004 Looking Glass Ct
- 8512 Silsbee Dr
- 8511 Bright Loop
- 8219 Martello Ln
- 8118 Primanti Blvd
- 7504 Panther Branch Dr
- 8143 Rhiannon Rd
- 8253 Martello Ln
- 8209 Shadow Stone Ct
- 8106 Sommerwell St
- 8518 Arboles Ct
- 8412 Pilots View Dr
- 8310 Chimneycap Dr
- 7705 Jackson Dane Dr
- 8802 Orchard Grove Way
- 8806 Orchard Grove Way
- 8808 Orchard Grove Way
- 8810 Orchard Grove Way
- 8812 Orchard Grove Way
- 8814 Orchard Grove Way
- 8022 Beech Tree Ridge Trail
- 8816 Orchard Grove Way
- 8020 Beech Tree Ridge Trail
- 8785 Cypress Grove
- 8785 Cypress Grove Run
- 8018 Beech Tree Ridge Trail
- 8018 Beechtree Ridge Trail
- 8783 Cypress Grove Run
- 8781 Cypress Grove Run
- 8818 Orchard Grove Way
- 8016 Beech Tree Ridge Trail
- 8016 Beechtree Ridge Trail
- 8779 Cypress Grove Run
- 8792 Cypress Grove Run